十大MySQL性能分析工具匯總!專治MySQL性能瓶頸
前言
MySQL 數據庫最常見的兩個瓶頸是CPU和I/O的瓶頸。CPU在飽和的時候一般發生在數據裝入內存或從磁盤上讀取數據時候,磁盤I/O瓶頸發生在裝入數據遠大于內存容量的時候。
MySQL數據庫性能遇到瓶頸,如何快速定位問題的原因,是每個DBA或系統運維人員應該思考的問題。正確的借助一些性能分析工具,能夠幫助DBA或系統運維人員進行問題快速的定位。
下面小編匯總了一些 MySQL DBA工作中好用的性能分析工具,歡迎大家收藏轉發~
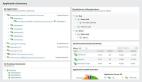
一、 Pt-qurey-digest
pt-query-digest主要用來分析mysql的慢日志,與mysqldumpshow工具相比,pt-querydigest 工具的分析結果更具體,更完善。pt-querydigest是PT工具集的子集。
1. 安裝
- yum install percona-toolkit-3.0.13-1.el7.x86_64.rpm
2. 用法
(1) 直接分析慢查詢文件:
- pt-query-digest /var/lib/mysql/slowtest-slow.log > slow_report.log
(2) 分析最近12小時內的查詢:
- pt-query-digest --since=12h /var/lib/mysql/slowtest-slow.log > slow_report2.log
(3) 分析指定時間范圍內的查詢:
- pt-query-digest /var/lib/mysql/slowtest-slow.log --since '2017-01-07 09:30:00' --until '2017-01-07 10:00:00'> > slow_report3.log
(4) 分析指含有select語句的慢查詢
- pt-query-digest --filter '$event->{fingerprint} =~ m/^select/i' /var/lib/mysql/slowtest-slow.log> slow_report4.log
(5) 針對某個用戶的慢查詢
- pt-query-digest --filter '($event->{user} || "") =~ m/^root/i' /var/lib/mysql/slowtest-slow.log> slow_report5.log
(6) 查詢所有所有的全表掃描或full join的慢查詢
- pt-query-digest --filter '(($event->{Full_scan} || "") eq "yes") ||(($event->{Full_join} || "") eq "yes")' /var/lib/mysql/slowtest-slow.log> slow_report6.log
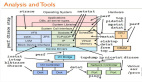
二、Innotop
innotop是一個MySQL和InnoDB事務/狀態監視器,它顯示查詢、InnoDB事務、鎖等待、死鎖、外鍵錯誤,打開表,復制狀態,緩沖區信息,行操作、日志、I/O操作、加載圖等等。你可以使用innotop同時監控多個服務器。innotp可以綜合解你的 MySQL。
1. 安裝innotop
- yum install innotop-1.11.4-1.el7.noarch
2. 使用方法
(1) 基本使用
- innotop --host 192.168.1.181 --user admin --password 123456 --port 3306 --delay 1 -m Q
(2) 參數說明,如下圖:
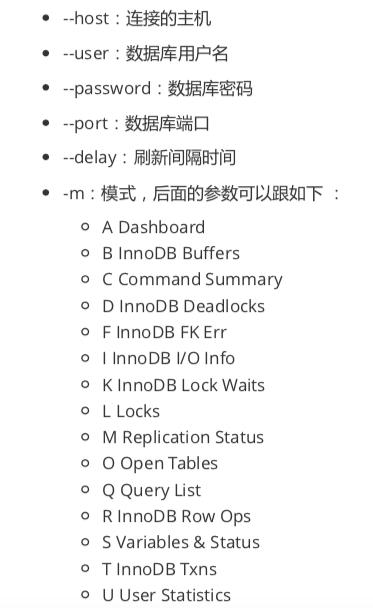
注意::?可以切換至其他命令。
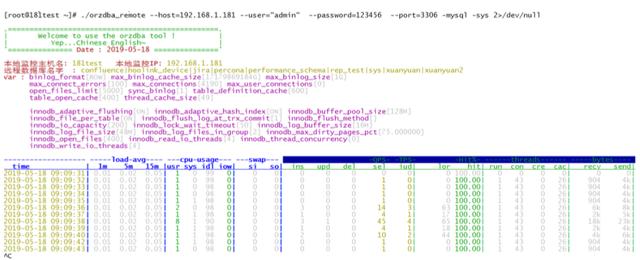
三、 Orzdba
是taobao開源出來一個數據庫實時性能查看工具,借助此工具你可以時刻了解的你的數據庫的性能情況。
使用方法:
- ./orzdba_remote --host=192.168.1.181 --user="admin" --password=123456 --port=3306 -mysql -sys 2>/dev/null
參數說明:
- --host:指定主機
- --user:指定用戶名
- --password:數據庫密碼
- --port:數據庫的端口號
四、 Tcp抓包
1. 安裝tcp包
- yum install tcpdump-4.9.2-3.el7.x86_64 -y
2. 使用
(1) 通過tcpdump抓包
- tcpdump -i any port 3306 -l -s 0 -w - |strings |grep -A 5 select|less
(2) tcpdump+pt-query-digest
- tcpdump -s 65535 -x -nn -q -tttt -i any -c 1000 port 3306 > mysql.tcp.txt
- pt-query-digest --type tcpdump mysql.tcp.txt> slow_report9.log
五、ioprofile
1. pt-ioprofile
pt-ioprofile定位負載來源文件,通過ps找出負載較高的進程。
2. 使用
- pt-ioprofile --profile-pid=12036 --cell=sizes
參數說明:
- --profile-pid:mysql進程的id
- --cell-sizes:該參數將結果已 B/s 的方式展示出來
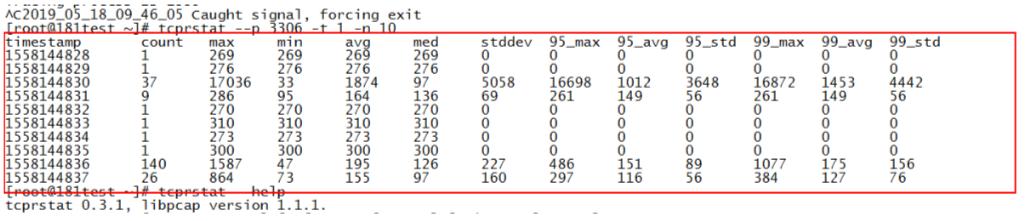
六、Tcprstat
通過響應時間判斷數據庫運行狀況
1. 安裝tcprstat
如果是在64位操作系統中使用,可以直接下載二進制文件使用。步驟如下:
- 下載文件 http://github.com/downloads/Lowercases/tcprstat/tcprstat-static.v0.3.1.x86_64
- 把下載的文件移動到 /usr/bin
- 把文件名修改為 tcprstat
- 修改文件權限,增加執行權限 chmod +x /usr/bin/tcprstat 如果你想在32位操作系統中使用,那你只能自己編譯了。
代碼下載地址 https://github.com/Lowercases/tcprstat https://launchpad.net/tcprstat
2. 使用
- [root@localhost ~]# tcprstat --p 3306 -t 1 -n 10
- timestamp count max min avg med stddev 95_max 95_avg 95_std 99_max 99_avg 99_std
- 1539760803 1 103 103 103 103 0 0 0 0 0 0 0
- 1539760804 1 108 108 108 108 0 0 0 0 0 0 0
- 1539760805 1 124 124 124 124 0 0 0 0 0 0 0
- 1539760806 1 115 115 115 115 0 0 0 0 0 0 0
- 1539760807 1 112 112 112 112 0 0 0 0 0 0 0
每個請求的時間在0.1ms~0.124ms
參數說明:
- --p:數據庫端口號
- -t:刷新間隔時間
- -n:輸出次數
七、 Nicstat
nicstat網絡利器,充分了解你的網卡運行狀況)
1. 安裝nicstat
- yum install http://rpmfind.net/linux/fedora/linux/releases/28/Everything/x8664/os/Packages/n/nicstat-1.95-7.fc27.x8664.rpm
2. 使用方法
- [root@lkjtest ~]# nicstat -z 1
- Time Int rKB/s wKB/s rPk/s wPk/s rAvs wAvs %Util Sat
- 15:29:14 ens160 4.03 0.91 43.18 1.60 95.61 581.8 0.00 0.00
- 15:29:15 ens160 3.09 0.73 35.95 2.00 88.11 375.5 0.00 0.00
- 15:29:16 ens160 3.93 0.66 43.99 2.00 91.52 335.5 0.00 0.00
- 15:29:17 ens160 3.99 0.66 45.00 2.00 90.71 335.5 0.00 0.00
- 15:29:18 ens160 4.04 0.66 46.99 2.00 88.04 335.5 0.00 0.00
- 15:29:19 ens160 3.64 0.66 42.00 2.00 88.76 335.5 0.00 0.00
參數說明:
- -z:跳過0行
輸出參數說明:
- wKB/s,OutKB #每秒寫的千字節數(transmitted)
- rMbps,RdMbps #每秒讀的百萬字節數K(received)
- %Util #接口的利用率百分比
- Sat #每秒的錯誤數,接口接近飽和的一個指標
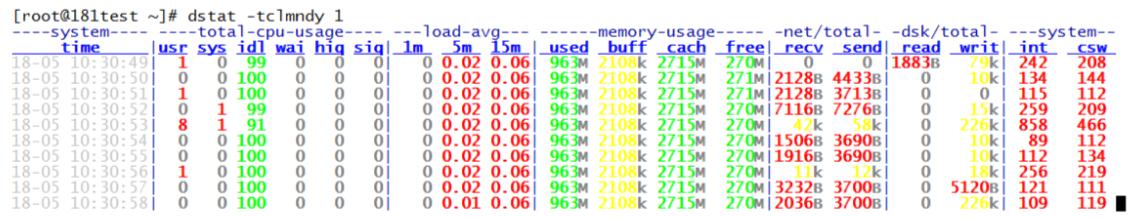
八、 Dstat
1. 安裝dstat
- yum install dstat -y
2. 使用
- [root@localhost ~]# dstat -tclmndy 1
參數說明:
- -t:enable time/date output
- -c:enable cpu stats
- -l:enable load stats
- -m:enable memory stats
- -n:enable network stats
- -d:enable disk stats
- -y:enable system stats
九、 vmtouch
vmtouch是一個學習和控制unix和類unix系統的文件系統緩存的工具。
1. 快速安裝
- $ git clone https://github.com/hoytech/vmtouch.git
- $ cd vmtouch
- $ make
- $ sudo make install
2. 使用方法
顯示
- $ vmtouch -v big-dataset.txt
回收
- vmtouch -ve a.txt
十、 oprofile
Oprofile 是一個開源的profiling工具,通過取樣來工作,是一個全局的抽樣統計工具。cpu無端占用高?應用程序響應慢?苦于沒有分析的工具?找它就對了!通過計數采樣,幫助我們從進程、函數、代碼層面找出占用cpu的"罪魁禍首"。
1. 安裝
- yum install http://www.rpmfind.net/linux/centos/7.5.1804/os/x86_64/Packages/oprofile-0.9.9-25.el7.x86_64.rpm -y
2. 使用方法
(1) 使用
- #加載oprofile內核模塊 opcontrol --init
- #我們對內核的取樣沒興趣 opcontrol --setup --no-vmlinux
- #在開始收集采樣數據前回顧下我們的設置 opcontrol --status
- #清除上一次采樣到的數據 opcontrol --reset
- #運行我們的程序 opcontrol --start
- #收集采樣數據 opcontrol --dump
- #關閉守護程序, 同時準備好采樣的數據 opcontrol --shutdown
注意:如報Cannot find event CPUCLKUNHALTED,解決方法如下:
- #解決步驟
- $sudo opcontrol --deinit
- Daemon not running
- Unloading oprofile module
- $sudo modprobe oprofile timer=1
- $dmesg|grep oprofile|tail -n 1
- oprofile: using timer interrupt.
- 如果你看到上面的字說明你成功了。
- 我們再試驗下:
- $sudo opcontrol --init && sudo opcontrol --reset && sudo opcontrol --start
- Using 2.6+ OProfile kernel interface.
- Using log file /var/lib/oprofile/samples/oprofiled.log
- Daemon started.
- Profiler running.
(2) 獲取采樣信息
- #系統級別的 opreport --long-filenames
- #模塊級別的 opreport image:foo -l
- #源碼級別的 opannotate image:foo -s
(3) 使用樣例
- opcontrol --deinit
- modprobe oprofile timer=1
- $dmesg|grep oprofile|tail -n 1
- (oprofile: using timer interrupt.)
- opcontrol --reset
- pcontrol --separate=lib --no-vmlinux
- --start --image=/home/mysql_user/mysqlhome/bin/mysqld
- opcontrol --dump
- opcontrol --shutdown
- opreport -l /home/mysql_user/mysqlhome/bin/mysqld