分享兩個實用SQL--查看故障時間等待事件、問題sql及會話訪問次數
作者:波波說運維
分享兩個SQL,這兩個SQL只是基礎原型,大家自己自定義條件去做一些調整。主要是在前面講過的dba_hist_active_sess_history相關sql上總結出來的比較實用的sql。
分享兩個SQL,這兩個SQL只是基礎原型,大家自己自定義條件去做一些調整。主要是在前面講過的dba_hist_active_sess_history相關sql上總結出來的比較實用的sql。
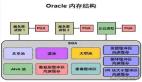
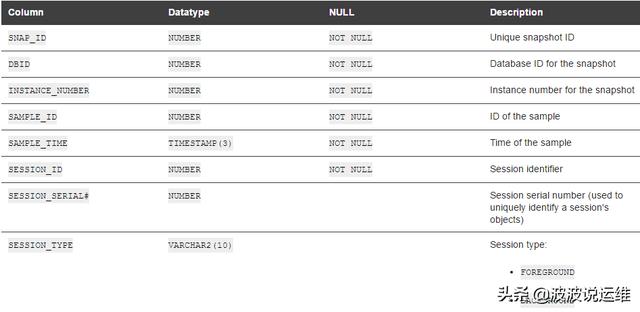
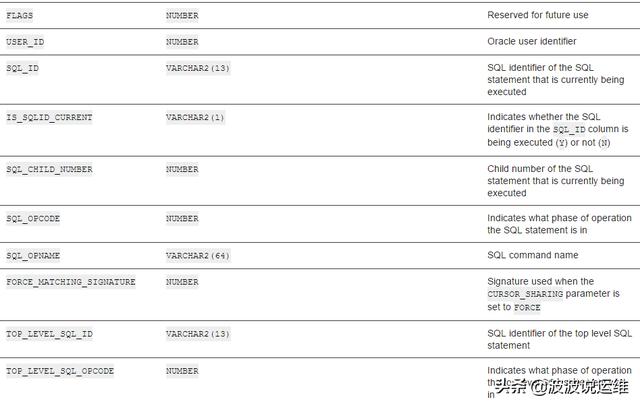
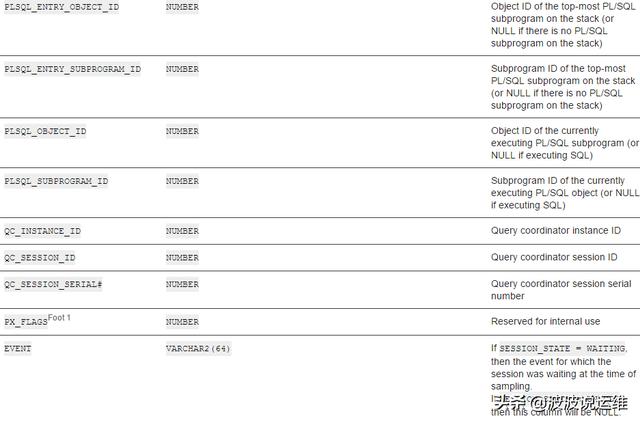
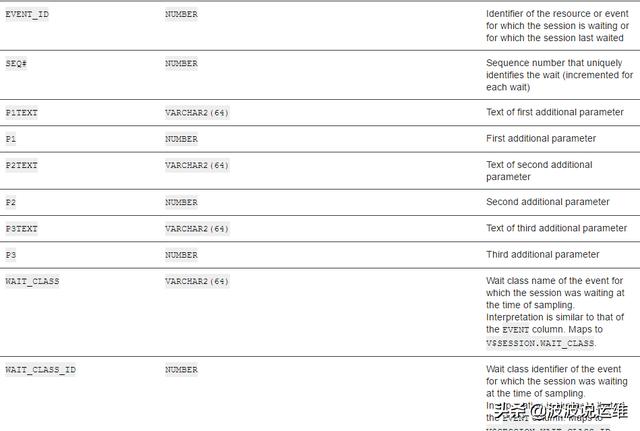
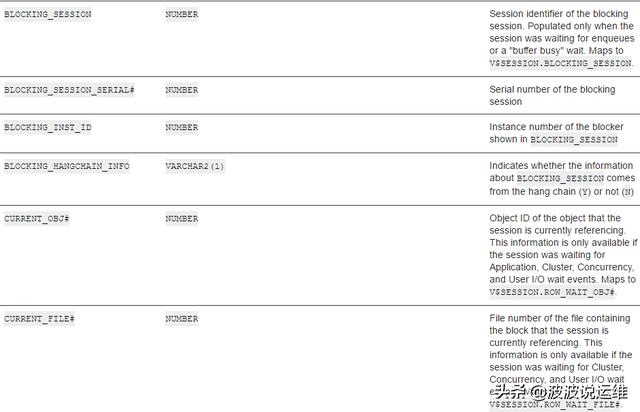
DBA_HIST_ACTIVE_SESS_HISTORY
DBA_HIST_ACTIVE_SESS_HISTORY displays the history of the contents of the in-memory active session history of recent system activity. This view contains snapshots of V$ACTIVE_SESSION_HISTORY. See "V$ACTIVE_SESSION_HISTORY" for further interpretation details for many of these columns (except SNAP_ID, DBID, and INSTANCE_NUMBER).
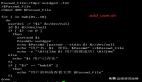
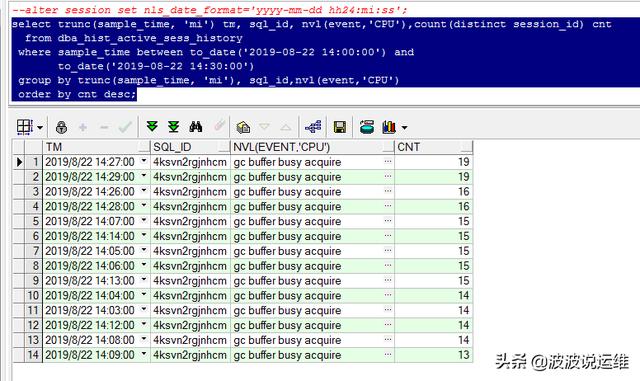
查看故障時間段等待事件、問題sql id及會話訪問次數
- --alter session set nls_date_format='yyyy-mm-dd hh24:mi:ss';
- select trunc(sample_time, 'mi') tm, sql_id, nvl(event,'CPU'),count(distinct session_id) cnt
- from dba_hist_active_sess_history
- where sample_time between to_date('2019-08-22 14:00:00') and
- to_date('2019-08-22 14:30:00')
- group by trunc(sample_time, 'mi'), sql_id,nvl(event,'CPU')
- order by cnt desc;
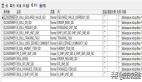
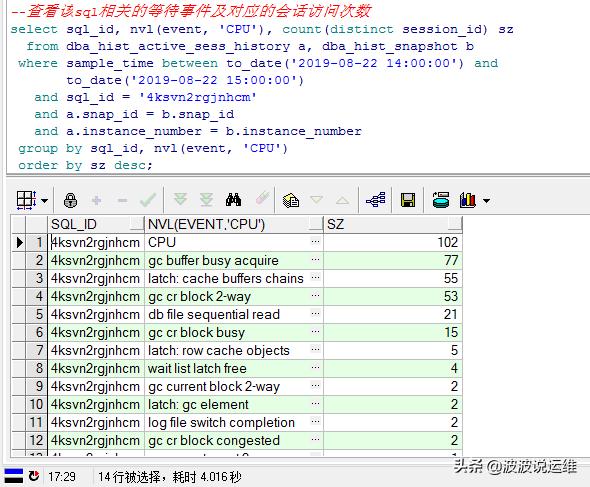
查看該sql相關的等待事件及對應的會話訪問次數
- select sql_id, nvl(event, 'CPU'), count(distinct session_id) sz
- from dba_hist_active_sess_history a, dba_hist_snapshot b
- where sample_time between to_date('2019-08-22 14:00:00') and
- to_date('2019-08-22 15:00:00')
- and sql_id = '4ksvn2rgjnhcm'
- and a.snap_id = b.snap_id
- and a.instance_number = b.instance_number
- group by sql_id, nvl(event, 'CPU')
- order by sz desc;
責任編輯:趙寧寧
來源:
今日頭條