VS Code調試太難?這款可視化代碼調試工具值得擁有
這是一個在調試期間可視化數據結構的 VS Code 擴展,使用它之后,你可以清晰明了的看到不同數據之間的關系。
一個名叫 hediet 的外國程序員開源了一個在調試期間可視化數據結構的 VS Code 擴展——Debug Visualizer。
這個擴展程序可以在 VS Code 中調試任何編程語言,當然,目前最適配的編程語言是 JavaScript 和 TypeScript,另外 C#、Java 和 PHP 也進行了相應的測試。
1. 如何安裝使用?
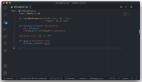
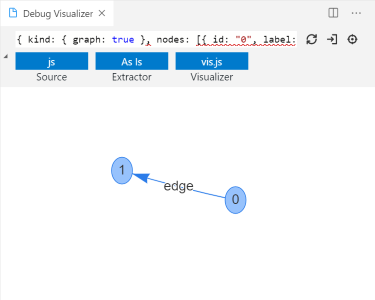
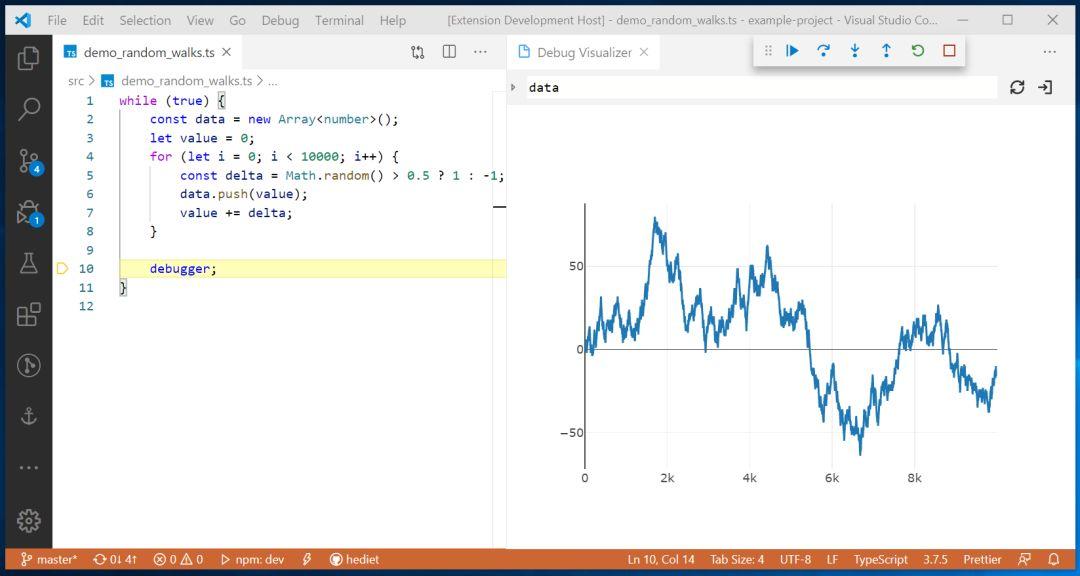
安裝此擴展后,使用命令 Open a new Debug Visualizer View 打開新的可視化器視圖。在這個視圖中,你可以輸入一個表達式,該表達式在逐步分析你的代碼時會進行評估和可視化,例如
- kind: { graph: true },
- nodes: [ { id: "1", label: "1" }, { id: "2", label: "2" } ],
- edges: [{ from: "1", to: "2", label: "edge" }]
你可以通過編寫自己的函數,從自定義數據結構中提取這些調試數據。
2. 哪些數據可被可視化呢?
很多人可能會問,這個可視化代碼調試工具都支持哪些東西可視化呢?基本上你能想到的,它都可以做到可視化。
圖形可視化
Graphviz 和 Vis.js 可視化工具可以渲染與 Graph 界面匹配的數據。
- interface Graph {
- kind: { graph: true };
- nodes: NodeGraphData[];
- edges: EdgeGraphData[];
- }
- interface NodeGraphData {
- id: string;
- label?: string;
- color?: string;
- shape?: "ellipse" | "box";
- }
- interface EdgeGraphData {
- from: string;
- to: string;
- label?: string;
- id?: string;
- color?: string;
- dashes?: boolean;
- }
graphviz 可視化工具可以通過使用 SVG 查看器來查看 viz.js 創建的 SVG。
Plotly 可視化
plotly visualizer 可以通過 plotly 來渲染與界面匹配的 JSON 數據。
- export interface Plotly {
- kind: { plotly: true };
- data: Partial<Plotly.Data>[];
- }
- // See plotly docs for Plotly.Data.
Tree 可視化
樹可視化器渲染與 Tree 接口匹配的數據。
- interface Tree<TData = unknown> {
- kind: { tree: true };
- root: TreeNode<TData>;
- }
- interface TreeNode<TExtraData> {
- id: string | undefined;
- name: string;
- value: string | undefined;
- emphasizedValue: string | undefined;
- children: TreeNode<TExtraData>[];
- data: TExtraData;
- isMarked: boolean;
- }
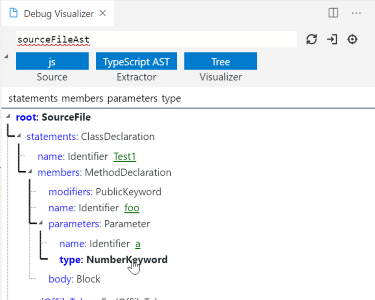
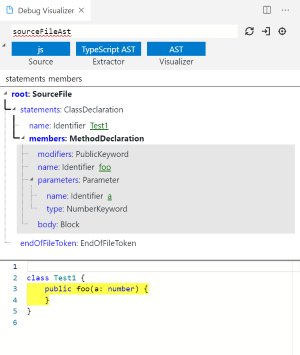
AST 可視化
AST 可視化工具渲染與 Ast 接口匹配的數據。
- interface Ast
- extends Tree<{
- position: number;
- length: number;
- }>,
- Text {
- kind: { text: true; tree: true; ast: true };
- }
除了樹視圖外,AST 可視化工具還會高亮顯示源代碼的來源。
Grid 可視化
Grid 可視化工具會渲染與以下接口匹配的數據。
- export interface Grid {
- kind: { array: true };
- columnLabels?: { label?: string }[];
- rows: {
- label?: string;
- columns: {
- content?: string;
- tag?: string;
- color?: string;
- }[];
- }[];
- markers?: {
- id: string;
- row: number;
- column: number;
- rows?: number;
- columns?: number;
- label?: string;
- color?: string;
- }[];
- }
Text 可視化
文本可視化工具渲染與 Text 接口匹配的數據。
- interface Text {
- kind: { text: true };
- text: string;
- mimeType?: string;
- fileName?: string;
- }
mimeType 和 fileName 的文件擴展名用于語法高亮顯示。
SVG 可視化
SVG 可視化工具渲染與 Svg 接口匹配的數據。實際的 SVG 數據必須存儲在 text 中。
- interface Svg extends Text {
- kind: { text: true; svg: true };
- }
點圖可視化
點圖可視化工具渲染與 DotGraph 接口匹配的數據。
- interface DotGraph extends Text {
- kind: { text: true; dotGraph: true };
- }
Viz.js(Graphviz)用于渲染。
3. 哪些數據可被提取?
該工具中包含有 JavaScript/TypeScript 數據提取器,數據提取器可將任意值轉換為可視化數據。這個擴展會自動在被調試者中注入以下數據提取器,當然用戶也可以注冊自定義數據提取器。
ToString
只需對值調用 .toString() ,就可將數據轉換為文本類型。
TypeScript AST
- 直接可視化 ts.Node
- Record 和 [ts.Node] 的可視化。如果記錄包含 fn 鍵,則將為每個節點顯示它們的值。
As Is 數據提取器
將數據直接輸入到可視化工具。
使用方法 getDebugVisualization
調用 .getDebugVisualization(),就可將數據轉換為可視化工具的直接輸入。
Plotly y-Values
使用 plotly 繪制數字數組。
對象圖
構造一個圖形,其中包含從表達式求值到的對象可到達的所有對象。使用廣度搜索構造圖,在 50 個節點后停止。
Array Grid
可以為數組數據創建 Grid visualization。
4. 其它事項
該擴展支持多行表達式,例如點擊 shift+enter 可添加新行,點擊 ctrl+enter 可計算表達式。當只有一行時, enter 是提交當前表達式,當有多行時,enter 插入另一個換行符。
經過該擴展程序開發者的測試,可與 TypeScript / JavaScript 庫一起很好地工作。
GitHub 開源地址:
https://github.com/hediet/vscode-debug-visualizer/tree/master/extension