從入門到掉坑:Go 內存池/對象池技術介紹
作者:deryzhou,騰訊 PCG 后臺開發工程師
Go 中怎么實現內存池,直接用 map 可以嗎?常用庫里 GroupCache、BigCache 的內存池又是怎么實現的?有沒有坑?對象池又是什么?想看重點的同學,可以直接看第 2 節 GroupCache 總結。
0. 前言: tcmalloc 與 Go
以前 C++服務上線,遇到性能優化一定會涉及 Google 大名鼎鼎的 tcmalloc。
相比 glibc,tcmalloc 在多線程下有巨大的優勢:
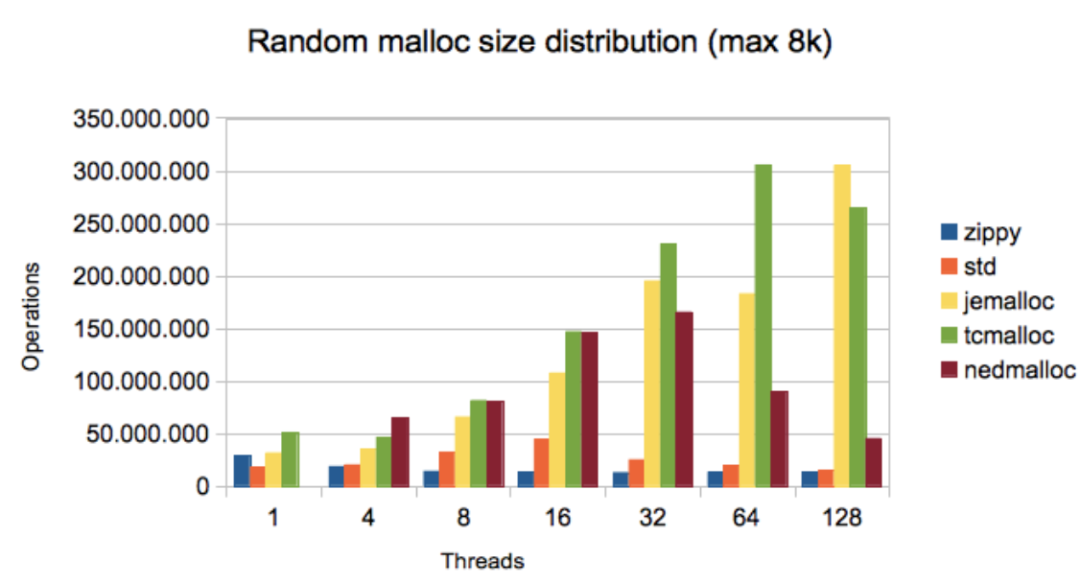
vs tcmalloc
其中使用的就是內存池技術。如果想了解 tcmalloc 的細節,盜一張圖解 TCMalloc中比較經典的結構圖:
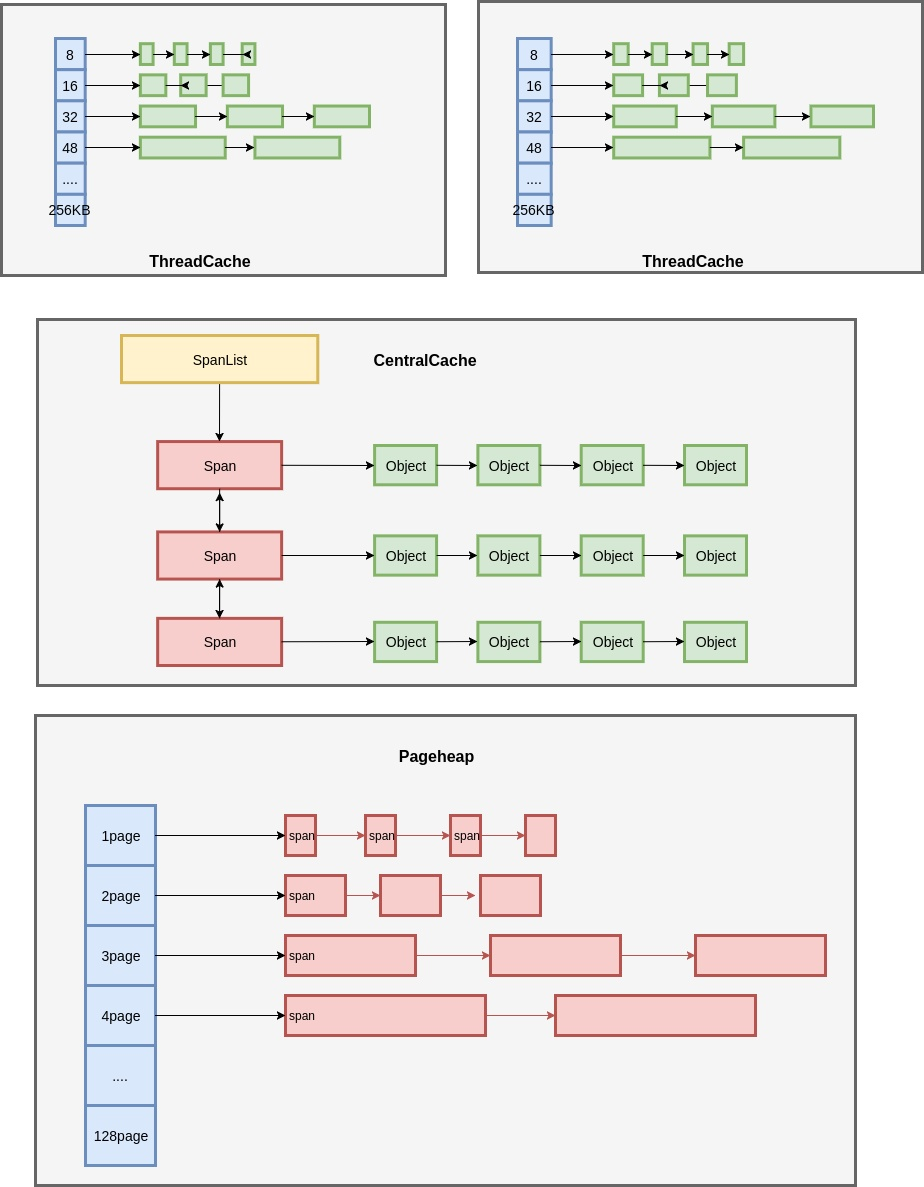
圖解 TCMalloc
作為 Google 的得意之作,Golang自然也用上了 tcmalloc 的內存池03 技術。因此我們普通使用 Golang 時,無需關注內存分配的性能問題。
1. 關于 map 你需要了解的
既然 Go 本身內存已經做了 tcmalloc 的管理,那實現緩存我們能想到的就是 map 了,是吧?(但仔細想想,map 不需要加鎖嗎?不加鎖用 sync.Map 更好嗎)
坑 1: 為什么不用 sync.Map
2020-05-09 補充:多位同學也提到了,bigcache 這個測試并不公平。查了下 issues,map+lock 和 sync.Map 的有人做過測試,性能確實低一些(單鎖的情況)https://github.com/golang/go/issues/28938#issuecomment-441737879但如果是 shards map+lock 和 sync.Map,在不同的讀寫比(比如讀多寫少,當超時才更新)時,這塊就不好判斷哪種實現更優了,有興趣的同學可以嘗試深挖下(而且 doyenli 也提到,sync.Map 內部是 append only 的)
用過 map 的同學應該會知道,map 并不是線程安全的。多個協程同步更新 map 時,會有概率導致程序 core 掉。
那我們為什么不用sync.Map?當然不是因為 go 版本太老不支持這種膚淺原因。
https://github.com/allegro/bigcache-bench 里有張對比數據,純寫 map 是比 sync.Map 要快很多,讀也有一定優勢。考慮到多數場景下讀多寫少,我們只需對 map 加個讀寫鎖,異步寫的問題就搞定了(還不損失太多性能)。
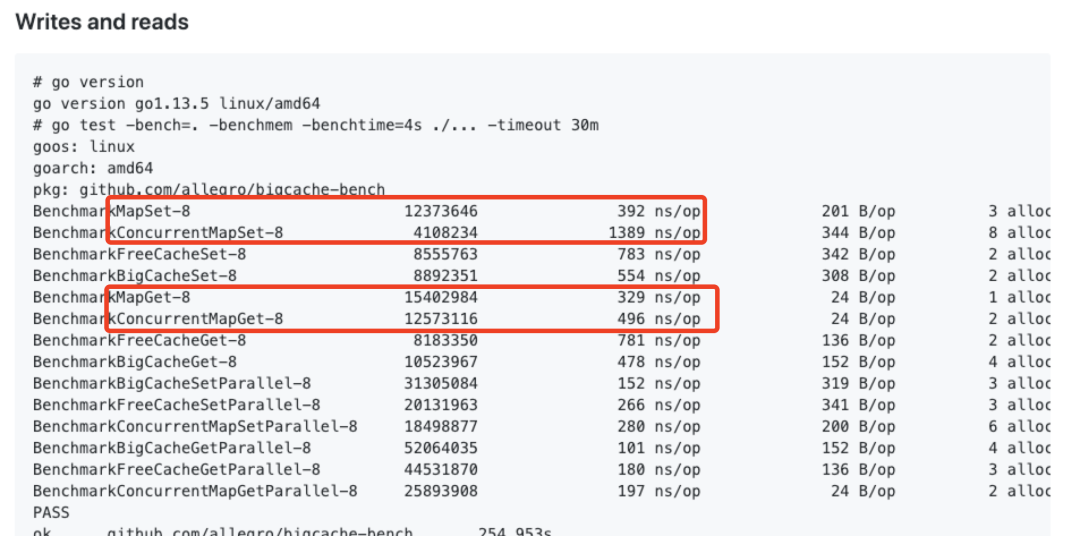
map vs sync.Map
除了讀寫鎖,我們還可以使用 shard map 的分布式鎖來繼續提高并發(后面 bigcache 部分會介紹),所以你看最終的 cache 庫里,大家都沒用 sync.Map,而是用map+讀寫鎖來實現存儲。
坑 2: 用 map 做內存池就可以了?
并不能。map 存儲 keys 也是有限制的,當 map 中 keys 數量超過千萬級,有可能造成性能瓶頸。
這個是我在之前業務中實際遇到的情況,當時服務里用了 GroupCache 做緩存,導致部分線上請求會超時(0.08%左右的超時率)。我們先暫時放下這個問題,弄清原因再來介紹這里的差異。
找了下資料,發現 2014 年 Go 有個 issue 提到 Large maps cause significant GC pauses 的問題。簡單來說就是當 map 中存在大量 keys 時,GC 掃描 map 產生的停頓將不能忽略。
好消息是 2015 年 Go 開發者已經對 map 中無指針的情況進行了優化:
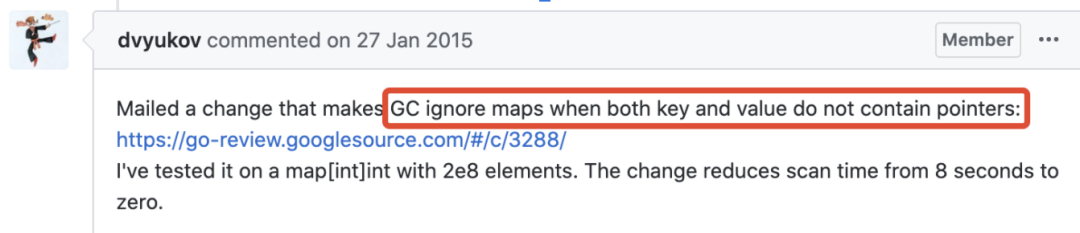
GC ignore maps with no pointers
我們參考其中的代碼,寫個GC 測試程序驗證下:
- package main
- import (
- "fmt"
- "os"
- "runtime"
- "time"
- )
- // Results of this program on my machine:
- //
- // for t in 1 2 3 4 5; do go run maps.go $t; done
- //
- // Higher parallelism does help, to some extent:
- //
- // for t in 1 2 3 4 5; do GOMAXProcS=8 go run maps.go $t; done
- //
- // Output(go 1.14):
- // With map[int32]*int32, GC took 456.159324ms
- // With map[int32]int32, GC took 10.644116ms
- // With map shards ([]map[int32]*int32), GC took 383.296446ms
- // With map shards ([]map[int32]int32), GC took 1.023655ms
- // With a plain slice ([]main.t), GC took 172.776µs
- func main() {
- const N = 5e7 // 5000w
- if len(os.Args) != 2 {
- fmt.Printf("usage: %s [1 2 3 4]\n(number selects the test)\n", os.Args[0])
- return
- }
- switch os.Args[1] {
- case "1":
- // Big map with a pointer in the value
- m := make(map[int32]*int32)
- for i := 0; i < N; i++ {
- n := int32(i)
- m[n] = &n
- }
- runtime.GC()
- fmt.Printf("With %T, GC took %s\n", m, timeGC())
- _ = m[0] // Preserve m until here, hopefully
- case "2":
- // Big map, no pointer in the value
- m := make(map[int32]int32)
- for i := 0; i < N; i++ {
- n := int32(i)
- m[n] = n
- }
- runtime.GC()
- fmt.Printf("With %T, GC took %s\n", m, timeGC())
- _ = m[0]
- case "3":
- // Split the map into 100 shards
- shards := make([]map[int32]*int32, 100)
- for i := range shards {
- shards[i] = make(map[int32]*int32)
- }
- for i := 0; i < N; i++ {
- n := int32(i)
- shards[i%100][n] = &n
- }
- runtime.GC()
- fmt.Printf("With map shards (%T), GC took %s\n", shards, timeGC())
- _ = shards[0][0]
- case "4":
- // Split the map into 100 shards
- shards := make([]map[int32]int32, 100)
- for i := range shards {
- shards[i] = make(map[int32]int32)
- }
- for i := 0; i < N; i++ {
- n := int32(i)
- shards[i%100][n] = n
- }
- runtime.GC()
- fmt.Printf("With map shards (%T), GC took %s\n", shards, timeGC())
- _ = shards[0][0]
- case "5":
- // A slice, just for comparison to show that
- // merely holding onto millions of int32s is fine
- // if they're in a slice.
- type t struct {
- p, q int32
- }
- var s []t
- for i := 0; i < N; i++ {
- n := int32(i)
- s = append(s, t{n, n})
- }
- runtime.GC()
- fmt.Printf("With a plain slice (%T), GC took %s\n", s, timeGC())
- _ = s[0]
- }
- }
- func timeGC() time.Duration {
- start := time.Now()
- runtime.GC()
- return time.Since(start)
- }
代碼中一共測試了 5 種情況,寫入5000w的 keys 后,主動觸發 2 次 GC 來測量耗時:
- [1] With map[int32]*int32, GC took 456.159324ms
- [2] With map[int32]int32, GC took 10.644116ms
- [3] With map shards ([]map[int32]*int32), GC took 383.296446ms
- [4] With map shards ([]map[int32]int32), GC took 1.023655ms
- [5] With a plain slice ([]main.t), GC took 172.776µs
可以看到,當 map 中沒有指針時,掃描停頓時間大約在 10ms 左右,而包含指針int32時則會擴大 45 倍。
先看 5 的數據,單純的 slice 速度飛快,基本沒有 GC 消耗。而 map shards 就有點耐人尋味了,為什么我們沒有對 map 加鎖,分 shard 后 GC 時間還是縮短了呢?說好的將鎖分布式化,才能提高性能呢?
坑 3: shards map 能提高性能的元兇(原因)
要了解 shards map 性能變化的原因,需要先弄清楚 Golang GC 的機制。我們先加上GODEBUG=gctrace=1觀察下 map 里包含指針與沒有指針的 gc 差異:
map[]*int: gc 11 @11.688s 2%: 0.004+436+0.004 ms clock, 0.055+0/1306/3899+0.049 ms cpu, 1762->1762->1220 MB, 3195 MB goal, 12 P (forced)map[]int: gc 10 @9.357s 0%: 0.003+14+0.004 ms clock, 0.046+0/14/13+0.054 ms cpu, 1183->1183->746 MB, 2147 MB goal, 12 P (forced)
輸出各字段含義可以看GODEBUG 之 gctrace 干貨解析,這里我們只關注 cpu 里0.055+0/1306/3899+0.049 ms cpu 這段的解釋:
- Mark Prepare (STW) - 0.055 表示整個進程在 mark 階段 STW 停頓時間
- Marking - 0/1306/3899 三段信息,其中 0 是 mutator assist 占用時間,1306 是 dedicated mark workers+fractional mark worker 占用的時間,3899 是 idle mark workers 占用的時間(雖然被拆分為 3 種不同的 gc worker,過程中被掃描的 P 還是會暫停的,另外注意這里時間是所有 P 消耗時間的總和)
- Mark Termination (STW) - 0.049 表示整個進程在 markTermination 階段 STW 停頓時間
只有 Mark 的前后兩個階段會導致 Stop-The-World(STW),中間 Marking 過程是并行的。這里 1306ms 是因為我們啟動了 12 個 P,1306ms 和 3899ms 是所有 P 消耗時間的綜合。雖然說是 Marking 是并行,但被掃描到的 P 還是會被暫停的。因此這個時間最終反映到業務程序上,就是某個 P 處理的請求,在 GC 時耗時突增(不穩定),不能被簡單的忽略
那回到上面的問題了,shards map 的性能又是如何得到提升(近 10 倍)的?
- // With map[int32]int32, GC took 11.285541ms
- gc 1 @0.001s 7%: 0.010+2.1+0.012 ms clock, 0.12+0.99/2.1/1.2+0.15 ms cpu, 4->6->6 MB, 5 MB goal, 12 P
- ...
- gc 8 @2.374s 0%: 0.003+3.9+0.018 ms clock, 0.042+0.31/6.7/3.1+0.21 ms cpu, 649->649->537 MB, 650 MB goal, 12 P
- gc 9 @4.834s 0%: 0.003+7.5+0.021 ms clock, 0.040+0/14/5.1+0.25 ms cpu, 1298->1298->1073 MB, 1299 MB goal, 12 P
- gc 10 @9.188s 0%: 0.003+26+0.004 ms clock, 0.045+0/26/0.35+0.053 ms cpu, 1183->1183->746 MB, 2147 MB goal, 12 P (forced)
- gc 11 @9.221s 0%: 0.018+9.4+0.003 ms clock, 0.22+0/17/5.0+0.043 ms cpu, 746->746->746 MB, 1492 MB goal, 12 P (forced)
- // With map shards ([]map[int32]int32), GC took 1.017494ms
- gc 1 @0.001s 7%: 0.010+2.9+0.048 ms clock, 0.12+0.26/3.6/4.1+0.57 ms cpu, 4->7->6 MB, 5 MB goal, 12 P
- ...
- gc 12 @3.924s 0%: 0.003+3.2+0.004 ms clock, 0.040+1.2/7.5/14+0.048 ms cpu, 822->827->658 MB, 840 MB goal, 12 P
- gc 13 @8.096s 0%: 0.003+6.1+0.004 ms clock, 0.044+6.0/14/32+0.053 ms cpu, 1290->1290->945 MB, 1317 MB goal, 12 P
- gc 14 @11.619s 0%: 0.003+1.2+0.004 ms clock, 0.045+0/2.5/3.7+0.056 ms cpu, 1684->1684->1064 MB, 1891 MB goal, 12 P (forced)
- gc 15 @11.628s 0%: 0.003+0.91+0.004 ms clock, 0.038+0/2.3/3.6+0.057 ms cpu, 1064->1064->1064 MB, 21
從倒數第三輪內存最大的時候看,GC worker 的耗時都是接近的;唯一差異較大的,是 markTermination 階段的 STW 時間,shard 方式下少了 1/10,因此推測和該階段得到優化有關。
至于這個時間為什么能減少,我也不清楚為什么(這個坑挖得太深,只能以后找到資料再來填...)
2. GroupCache
言歸正傳(眾人:什么?!前面寫這么多你還沒進入正文。我:咳..咳..),我們總結下用 map 實現內存池的要點:
- 內存池用 map 不用 sync.Map;map 要加讀寫鎖
- map 盡量存非指針(key 和 value 都不包含指針)
- map 里存放指針,需要注意 keys 過多會帶來的 GC 停頓問題
- 使用 shards map
然后我們看看GroupCache 的實現方法,這個定義在 lru/lru.go 里:
- // Cache is an LRU cache. It is not safe for concurrent access.
- type Cache struct {
- cache map[interface{}]*list.Element
- }
從 cache 的定義可以看出,這是我們說的 map 里包含指針的情況,而且還是不分 shards 的。所以如果你單機 GroupCache 里 keys 過多,還是要注意下用法的。
注:截止目前 1.14,map 里包含指針時 idle worker 耗時問題還未有結論,有興趣可以參考10ms-26ms latency from GC in go1.14rc1, possibly due to 'GC (idle)' work 里面的例子和現象。
3. BigCache
相比分布式場景的 GroupCache,如果你本地依然有千萬級的 keys,那推薦你用 bigcache。無數經驗證明,超大 map 的內存池導致的 GC 延遲,是可以通過切 bigcache 解決的。那 bigcache 到底怎么做到的?
簡單來說:shards map + map[uint]uint + []byte + free link = BigCache
- 定義 shards cache,避免鎖粒度過大
- map 里只存放 uint 避免指針
- 實現一個 queue 結構(實際是[]byte,通過 uint 下標追加分配)
- 采用 free 鏈機制,刪除保留空洞最后一起回收(這塊邏輯還蠻復雜的,先留個不大不小的坑吧...)
其內存池定義如下:
- type cacheShard struct {
- hashmap map[uint64]uint32 // key在entries中的位置
- entries queue.BytesQueue // 實際是[]byte,新數據來了后copy到尾部
- }
這樣 GC 就變成了map 無指針+[]byte 結構的掃描問題了,因此性能會高出很多。
坑 4: 兩種方式(GroupCache 和 BigCache)對具體業務到底有多大影響?
上面只是 map 實現內存池的模擬分析,以及兩種典型 Cache 庫的對比。如果你也和我一樣,問自己“具體兩種 Cache 對業務有多大影響呢”?那只能很高興的對你說:歡迎來到坑底 -_-
我們線上大概需要單機緩存 1000 萬左右的 keys。首先我嘗試模擬業務,向兩種 Cache 中插入 1000w 數據來測試 GC 停頓。然而因為實驗代碼或其他未知的坑,最后認為這個方法不太可側
最后討論,覺得還是用老辦法,用 Prometheus 的 histogram 統計耗時分布。我們先統計底層存儲(Redis)的耗時分布,然后再分別統計 BigCache 和 GroupCache 在寫入 500w 數據后的實際情況。分析結論可知:
40ms 以上請求
從 redis 數據看,40ms 以上請求占比0.08%;BigCache 的 40ms 以上請求占0.04%(即相反有一半以上超時請求被 Cache 擋住了) GroupCache 則是0.2%,將這種長時間請求放大了1倍多(推測和 map 的鎖機制有關)
10ms-40ms 請求
redis 本身這個區間段請求占比24.11%;BigCache 則只有15.51%,相當于擋掉了33%左右的高延遲請求(證明加熱點 Cache 還是有作用的) GroupCache 這個區間段請求占比21.55%,也比直接用 redis 來得好
詳細數據分布:
- redis [ 0.1] 0.00%
- redis [ 0.5] 0.38%
- redis [ 1] 3.48%
- redis [ 5] 71.94%
- redis [ 10] 22.90%
- redis [ 20] 1.21%
- redis [ 40] 0.07%
- redis [ +Inf] 0.01%
- bigcache [ 0.1] 0.40%
- bigcache [ 0.5] 16.16%
- bigcache [ 1] 14.82%
- bigcache [ 5] 53.07%
- bigcache [ 10] 14.85%
- bigcache [ 20] 0.66%
- bigcache [ 40] 0.03%
- bigcache [ +Inf] 0.01%
- groupcache[ 0.1] 0.24%
- groupcache[ 0.5] 9.59%
- groupcache[ 1] 9.69%
- groupcache[ 5] 58.74%
- groupcache[ 10] 19.10%
- groupcache[ 20] 2.45%
- groupcache[ 40] 0.17%
- groupcache[ +Inf] 0.03%
然而我們測完只能大致知道:本地使用 GroupCache 在 500w 量級的 keys 下,還是不如 BigCache 穩定的(哪怕 GroupCache 實現了 LRU 淘汰,但實際上因為有 Hot/Main Cache 的存在,內存利用效率上不如 BigCache)
分布式情況下,GroupCache 和 BigCache 相比又有多少差距,這個就只能挖坑等大家一起跳了。
4. 對象池與零拷貝
在實際業務中,往往 map 中并不會存儲 5000w 級的 keys。如果我們只有 50w 的 keys,GC 停頓就會驟減到 4ms 左右(其間 gc worker 還會并行工作,避免 STW)。
例如無極(騰訊內部的一個配置服務)這類配置服務(或其他高頻數據查詢場景),往往需要 Get(key) 獲取對應的結構化數據。而從 BigCache,CPU 消耗發現(如圖),相比網絡 IO 和 Protobuf 解析,Get 占用0.78%、Set 占用0.9%,基本可以忽略:
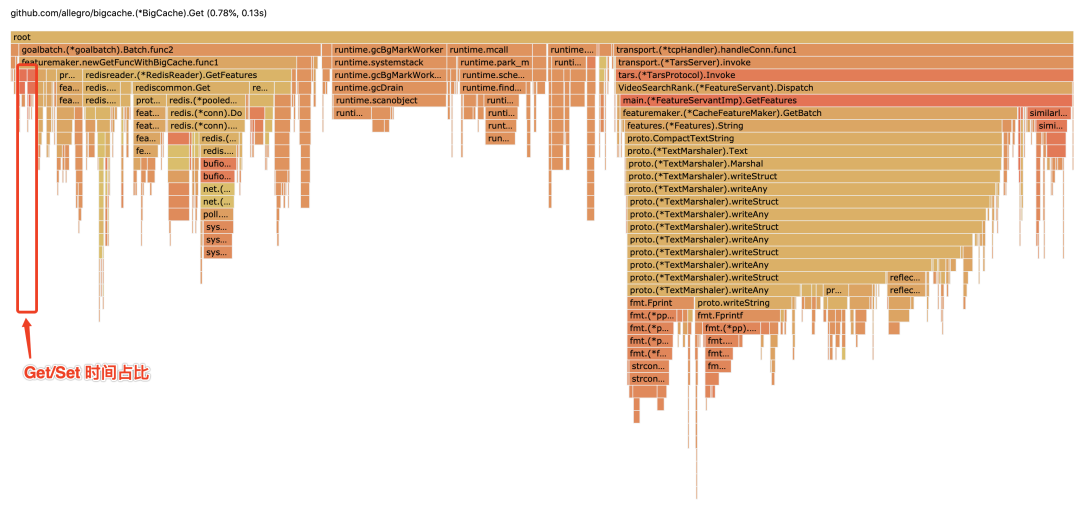
CPU profile
因此優化的思路也很明確,我們參考 GroupCache 的 lru 實現,將 JSON 提前解析好,在業務側 Get 時直接返回 struct 的指針即可。具體流程不復雜,直接 ppt 截圖:
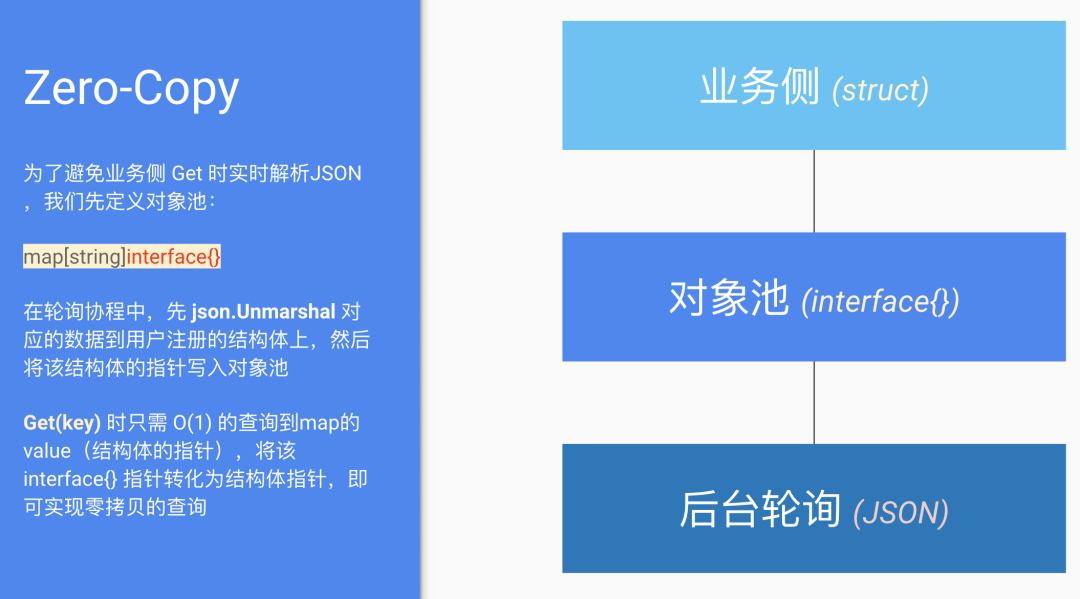
zero-copy
我們把接口設計成注冊的方式(注冊需要解析 JSON 數據的結構),然后再 Get 時返回該結構的指針實現零拷貝。下面 benchmark 可以反映性能差異和內存分配情況(Client_Get 是實時 JSON 解析,Filter_Get 是優化的對象池 API),可以切實看到0 allocs/op:
- goos: linux
- goarch: amd64
- pkg: open-wuji/go-sdk/wujiclient
- BenchmarkClient_Get-8 1000000 1154 ns/op 1.00 hits 87 B/op 3 allocs/op
- BenchmarkFilter_Get-8 4899364 302 ns/op 1.00 hits 7 B/op 1 allocs/op
- BenchmarkClient_GetParallel-8 8383149 162 ns/op 1.00 hits 80 B/op 2 allocs/op
- BenchmarkFilter_GetParallel-8 13053680 91.4 ns/op 1.00 hits 0 B/op 0 allocs/op
- PASS
- ok open-wuji/go-sdk/wujiclient 93.494s
- Success: Benchmarks passed.
目前無極尚未對外開源。對具體實現感興趣的同學,可以看 gist 中filter API 的實現代碼