Sampler:Shell命令執行可視化和告警工具
Sampler是一個用于shell命令執行,可視化和告警的工具。其配置使用的是一個簡單的YAML文件。

為什么我需要它?
你可以直接從終端對任意動態進程進行采樣 – 觀察數據庫中的更改,監控MQ動態消息(in-flight messages),觸發部署腳本并在完成后獲取通知。
如果有一種方法可以使用shell命令獲取指標(metric),那么可以使用Sampler立即對其進行可視化。
安裝
macOS
- brew cask install sampler
或
- sudo curl -Lo /usr/local/bin/sampler https://github.com/sqshq/sampler/releases/download/v1.0.3/sampler-1.0.3-darwin-amd64
- sudo chmod +x /usr/local/bin/sampler
Linux
- sudo wget https://github.com/sqshq/sampler/releases/download/v1.0.3/sampler-1.0.3-linux-amd64 -O /usr/local/bin/sampler
- sudo chmod +x /usr/local/bin/sampler
注意:需要為Sampler安裝libasound2-dev系統庫用以播放觸發器聲音。通常庫已安裝在相應位置,但如果沒有 – 你可以使用你習慣的包管理器進行安裝,例如apt install libasound2-dev
Windows(實驗)
建議在高級控制臺模擬器下使用,如Cmder
Download .exe
使用
指定shell命令,Sampler會相應的速率執行這些命令。輸出用于可視化。
使用Sampler基本上的三步過程:
在YAML配置文件中定義shell命令
運行sampler -c config.yml
在UI上調整組件大小和位置
市面早已有許多監控系統
Sampler絕不是監控系統的替代品,而是易于設置的開發工具。
如果spinning up和使用Grafana配置Prometheus是完全多余的任務,那么Sampler可能是正確的解決方案。沒有服務器,沒有數據庫,不需要部署 – 你指定了shell命令,它就可以工作了。
我監控的每臺服務器上都需要安裝嗎?
不,你可以在本地運行Sampler,但仍然可以從多臺遠程計算機上收集遙測數據。任何可視化都可能具有init命令,你可以在其中ssh到遠程服務器。請參閱SSH example
組件
以下是每種組件類型的配置示例列表,其中包含與macOS兼容的采樣腳本。
Runchart

- runcharts:
- - title: Search engine response time
- rate-ms: 500 # sampling rate, default = 1000
- scale: 2 # number of digits after sample decimal point, default = 1
- legend:
- enabled: true # enables item labels, default = true
- details: false # enables item statistics: cur/min/max/dlt values, default = true
- items:
- - label: GOOGLE
- sample: curl -o /dev/null -s -w '%{time_total}' https://www.google.com
- color: 178 # 8-bit color number, default one is chosen from a pre-defined palette
- - label: YAHOO
- sample: curl -o /dev/null -s -w '%{time_total}' https://search.yahoo.com
- - label: BING
- sample: curl -o /dev/null -s -w '%{time_total}' https://www.bing.com
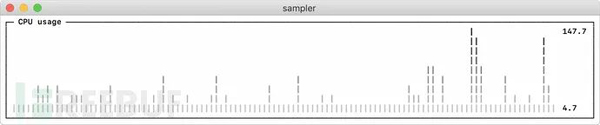
Sparkline

- sparklines:
- - title: CPU usage
- rate-ms: 200
- scale: 0
- sample: ps -A -o %cpu | awk '{s+=$1} END {print s}'
- - title: Free memory pages
- rate-ms: 200
- scale: 0
- sample: memory_pressure | grep 'Pages free' | awk '{print $3}'
Barchart
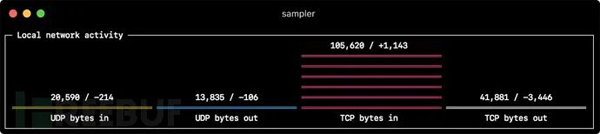
- barcharts:
- - title: Local network activity
- rate-ms: 500 # sampling rate, default = 1000
- scale: 0 # number of digits after sample decimal point, default = 1
- items:
- - label: UDP bytes in
- sample: nettop -J bytes_in -l 1 -m udp | awk '{sum += $4} END {print sum}'
- - label: UDP bytes out
- sample: nettop -J bytes_out -l 1 -m udp | awk '{sum += $4} END {print sum}'
- - label: TCP bytes in
- sample: nettop -J bytes_in -l 1 -m tcp | awk '{sum += $4} END {print sum}'
- - label: TCP bytes out
- sample: nettop -J bytes_out -l 1 -m tcp | awk '{sum += $4} END {print sum}'
Gauge
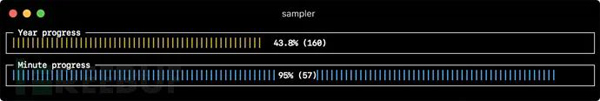
- gauges:
- - title: Minute progress
- rate-ms: 500 # sampling rate, default = 1000
- scale: 2 # number of digits after sample decimal point, default = 1
- percent-only: false # toggle display of the current value, default = false
- color: 178 # 8-bit color number, default one is chosen from a pre-defined palette
- cur:
- sample: date +%S # sample script for current value
- max:
- sample: echo 60 # sample script for max value
- min:
- sample: echo 0 # sample script for min value
- - title: Year progress
- cur:
- sample: date +%j
- max:
- sample: echo 365
- min:
- sample: echo 0
Textbox

- textboxes:
- - title: Local weather
- rate-ms: 10000 # sampling rate, default = 1000
- sample: curl wttr.in?0ATQF
- border: false # border around the item, default = true
- color: 178 # 8-bit color number, default is white
- - title: Docker containers stats
- rate-ms: 500
- sample: docker stats --no-stream --format "table {{.Name}}\t{{.CPUPerc}}\t{{.MemUsage}}\t{{.PIDs}}"
Asciibox

- asciiboxes:
- - title: UTC time
- rate-ms: 500 # sampling rate, default = 1000
- font: 3d # font type, default = 2d
- border: false # border around the item, default = true
- color: 43 # 8-bit color number, default is white
- sample: env TZ=UTC date +%r
額外功能
Triggers
觸發器允許執行條件操作,如視覺/聲音告警或任意shell命令。以下示例說明了此概念。
Clock gauge,從開始的每分鐘顯示時間進度和當前時間
- gauges:
- - title: MINUTE PROGRESS
- position: [[0, 18], [80, 0]]
- cur:
- sample: date +%S
- max:
- sample: echo 60
- min:
- sample: echo 0
- triggers:
- - title: CLOCK BELL EVERY MINUTE
- condition: '[ $label == "cur" ] && [ $cur -eq 0 ] && echo 1 || echo 0' # expects "1" as TRUE indicator
- actions:
- terminal-bell: true # standard terminal bell, default = false
- sound: true # NASA quindar tone, default = false
- visual: false # notification with current value on top of the component area, default = false
- script: say -v samantha `date +%I:%M%p` # an arbitrary script, which can use $cur, $prev and $label variables
搜索引擎延遲圖表,在延遲超過閾值時向用戶發出告警
- runcharts:
- - title: SEARCH ENGINE RESPONSE TIME (sec)
- rate-ms: 200
- items:
- - label: GOOGLE
- sample: curl -o /dev/null -s -w '%{time_total}' https://www.google.com
- - label: YAHOO
- sample: curl -o /dev/null -s -w '%{time_total}' https://search.yahoo.com
- triggers:
- - title: Latency threshold exceeded
- condition: echo "$prev < 0.3 && $cur > 0.3" |bc -l # expects "1" as TRUE indicator
- actions:
- terminal-bell: true # standard terminal bell, default = false
- sound: true # NASA quindar tone, default = false
- visual: true # visual notification on top of the component area, default = false
- script: 'say alert: ${label} latency exceeded ${cur} second' # an arbitrary script, which can use $cur, $prev and $label variables
交互式 shell 支持
除了sample命令之外,還可以指定init命令(在采樣前僅執行一次)和transform命令(后處理采樣命令輸出)。這包括交互式shell用例,例如僅建立與數據庫的連接一次,然后在交互式shell會話中執行輪詢。
Basic mode
- textboxes:
- - title: MongoDB polling
- rate-ms: 500
- init: mongo --quiet --host=localhost test # executes only once to start the interactive session
- sample: Date.now(); # executes with a required rate, in scope of the interactive session
- transform: echo result = $sample # executes in scope of local session, $sample variable is available for transformation
PTY mode
在某些情況下,交互式shell將無法工作,因為它的stdin不是終端。這種情況下我們可以使用PTY模式:
- textboxes:
- - title: Neo4j polling
- pty: true # enables pseudo-terminal mode, default = false
- init: cypher-shell -u neo4j -p pwd --format plain
- sample: RETURN rand();
- transform: echo "$sample" | tail -n 1
- - title: Top on a remote server
- pty: true # enables pseudo-terminal mode, default = false
- init: ssh -i ~/user.pem ec2-user@1.2.3.4
- sample: top
init 命令逐步執行
在開始采樣之前,還可以逐個執行多個init命令。
- textboxes:
- - title: Java application uptime
- multistep-init:
- - java -jar jmxterm-1.0.0-uber.jar
- - open host:port # or local PID
- - bean java.lang:type=Runtime
- sample: get Uptime
變量
如果配置文件包含重復的模式,則可以將它們提取到變量部分。此外,還可以在啟動時使用-v/–variable標志指定變量,并且任意的系統環境變量也可以在腳本中使用。
- variables:
- mongoconnection: mongo --quiet --host=localhost test
- barcharts:
- - title: MongoDB documents by status
- items:
- - label: IN_PROGRESS
- init: $mongoconnection
- sample: db.getCollection('events').find({status:'IN_PROGRESS'}).count()
- - label: SUCCESS
- init: $mongoconnection
- sample: db.getCollection('events').find({status:'SUCCESS'}).count()
- - label: FAIL
- init: $mongoconnection
- sample: db.getCollection('events').find({status:'FAIL'}).count()
顏色主題
- theme: light # default = dark
- sparklines:
- - title: CPU usage
- sample: ps -A -o %cpu | awk '{s+=$1} END {print s}'
真實場景
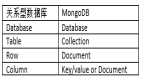
數據庫
以下是不同的數據庫連接示例。建議使用交互式shell(init腳本)僅建立一次連接,然后在采樣期間重用即可。
MySQL
- # prerequisite: installed mysql shell
- variables:
- mysql_connection: mysql -u root -s --database mysql --skip-column-names
- sparklines:
- - title: MySQL (random number example)
- pty: true
- init: $mysql_connection
- sample: select rand();
PostgreSQL
- # prerequisite: installed psql shell
- variables:
- PGPASSWORD: pwd
- postgres_connection: psql -h localhost -U postgres --no-align --tuples-only
- sparklines:
- - title: PostgreSQL (random number example)
- init: $postgres_connection
- sample: select random();
MongoDB
- # prerequisite: installed mongo shell
- variables:
- mongo_connection: mongo --quiet --host=localhost test
- sparklines:
- - title: MongoDB (random number example)
- init: $mongo_connection
- sample: Math.random();
Neo4j
- # prerequisite: installed cypher shell
- variables:
- neo4j_connection: cypher-shell -u neo4j -p pwd --format plain
- sparklines:
- - title: Neo4j (random number example)
- pty: true
- init: $neo4j_connection
- sample: RETURN rand();
- transform: echo "$sample" | tail -n 1
Kafka
檢查kafka lag值,計算每個隊列lag值的和,高于閾值報警,多consumergroup,多topic。
- variables:
- kafka_connection: $KAFKA_HOME/bin/kafka-consumer-groups --bootstrap-server localhost:9092
- runcharts:
- - title: Kafka lag per consumer group
- rate-ms: 5000
- scale: 0
- items:
- - label: A->B
- sample: $kafka_connection --group group_a --describe | awk 'NR>1 {sum += $5} END {print sum}'
- - label: B->C
- sample: $kafka_connection --group group_b --describe | awk 'NR>1 {sum += $5} END {print sum}'
- - label: C->D
- sample: $kafka_connection --group group_c --describe | awk 'NR>1 {sum += $5} END {print sum}'
Docker
Docker容器統計信息(CPU,MEM,O/I)
- textboxes:
- - title: Docker containers stats
- sample: docker stats --no-stream --format "table {{.Name}}\t{{.CPUPerc}}\t{{.MemPerc}}\t{{.MemUsage}}\t{{.NetIO}}\t{{.BlockIO}}\t{{.PIDs}}"
SSH
遠程服務器上的TOP命令
- variables:
- sshconnection: ssh -i ~/my-key-pair.pem ec2-user@1.2.3.4
- textboxes:
- - title: SSH
- pty: true
- init: $sshconnection
- sample: top
JMX
Java應用程序的正常運行示例
- # prerequisite: download [jmxterm jar file](https://docs.cyclopsgroup.org/jmxterm)
- textboxes:
- - title: Java application uptime
- multistep-init:
- - java -jar jmxterm-1.0.0-uber.jar
- - open host:port # or local PID
- - bean java.lang:type=Runtime
- sample: get Uptime
- transform: echo $sample | tr -dc '0-9' | awk '{printf "%.1f min", $1/1000/60}'