prometheus告警問題分析
作者:華仔
最近運維prometheus的過程中發現,有的時候它應該發送告警,可實際卻沒有;有的時候,不該發送告警卻發送了;還有的時候,告警出現明顯的延遲。為了找出其中的具體原因,特地去查閱了一些資料,同時也參考了官網的相關資料。希望對大家在今后使用prometheus有所幫助。
今天來說一下我在使用prometheus過程中遇到的告警問題。
問題分析
最近運維prometheus的過程中發現,有的時候它應該發送告警,可實際卻沒有;有的時候,不該發送告警卻發送了;還有的時候,告警出現明顯的延遲。為了找出其中的具體原因,特地去查閱了一些資料,同時也參考了官網的相關資料。希望對大家在今后使用prometheus有所幫助。
先來看一下官網提供的prometheus和alertmanager的一些默認的重要配置。如下所示:
- # promtheus
- global:
- # How frequently to scrape targets by default. 從目標抓取監控數據的間隔
- [ scrape_interval: <duration> | default = 1m ]
- # How long until a scrape request times out. 從目標住區數據的超時時間
- [ scrape_timeout: <duration> | default = 10s ]
- # How frequently to evaluate rules. 告警規則評估的時間間隔
- [ evaluation_interval: <duration> | default = 1m ]
- # alertmanager
- # How long to initially wait to send a notification for a group
- # of alerts. Allows to wait for an inhibiting alert to arrive or collect
- # more initial alerts for the same group. (Usually ~0s to few minutes.)
- [ group_wait: <duration> | default = 30s ] # 初次發送告警的等待時間
- # How long to wait before sending a notification about new alerts that
- # are added to a group of alerts for which an initial notification has
- # already been sent. (Usually ~5m or more.)
- [ group_interval: <duration> | default = 5m ] 同一個組其他新發生的告警發送時間間隔
- # How long to wait before sending a notification again if it has already
- # been sent successfully for an alert. (Usually ~3h or more).
- [ repeat_interval: <duration> | default = 4h ] 重復發送同一個告警的時間間隔
通過上面的配置,我們來看一下整個告警的流程。通過流程去發現問題。
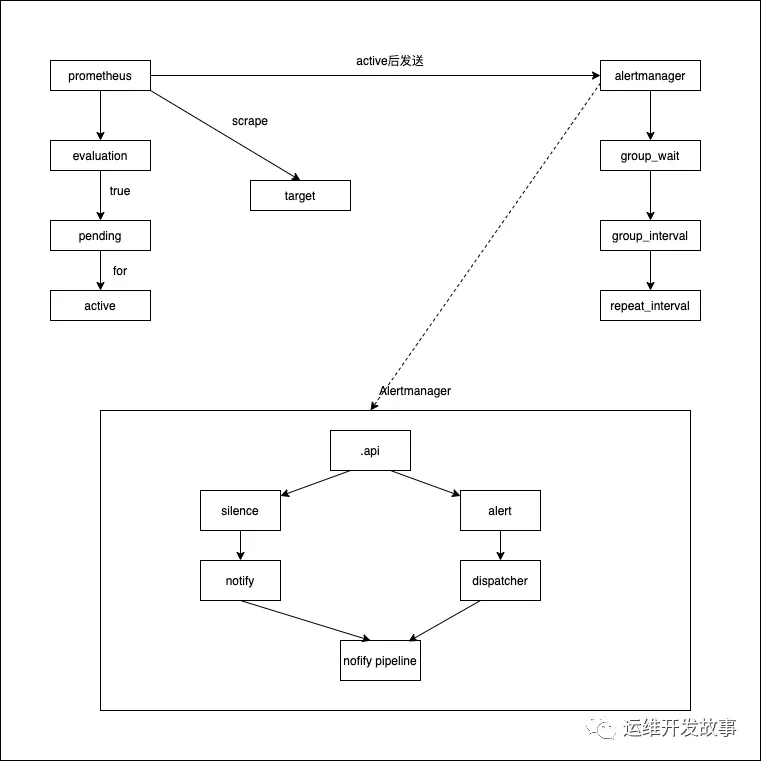
根據上圖以及配置來看,prometheus抓取數據后,根據告警規則計算,表達式為真時,進入pending狀態,當持續時間超過for配置的時間后進入active狀態;數據同時會推送至alertmanager,在經過group_wait后發送通知。
告警延遲或頻發
根據整個告警流程來看,在數據到達alertmanager后,如果group_wait設置越大,則收到告警的時間也就越長,也就會造成告警延遲;同理,如果group_wait設置過小,則頻繁收到告警。因此,需要按照具體場景進行設置。
不該告警的時候告警了
prometheus每經過scrape_interval時間向target拉取數據,再進行計算。與此同時,target的數據可能已經恢復正常了,也就是說,在for計算過程中,原數據已經恢復了正常,但是被告警跳過了,達到了持續時間,就觸發了告警,也就發送了告警通知。但從grafana中看,認為數據正常,不應發送告警。這是因為grafana以prometheus為數據源時,是range query,而不是像告警數據那樣稀疏的。

責任編輯:姜華
來源:
運維開發故事