效率神器之快速定位最慢的代碼
天下武功,唯快不破。
編程也不例外,你的代碼跑的快,你能快速找出代碼慢的原因,你的碼功就高。
今天分享一個超級實用的 Python 性能分析工具 pyinstrument ,可以快速找到代碼運行最慢的部分,幫助提高代碼的性能。支持 Python 3.7+ 且能夠分析異步代碼,僅需一條命令即可顯示具體代碼的耗時。經常寫 Python 的小伙伴一定要用一下。
安裝
- pip install pyinstrument
簡單的使用
在程序的開始,啟動 pyinstrument 的 Profiler,結束時關閉 Profiler 并打印分析結果如下:
- from pyinstrument import Profiler
- profiler = Profiler()
- profiler.start()
- # 這里是你要分析的代碼
- profiler.stop()
- profiler.print()
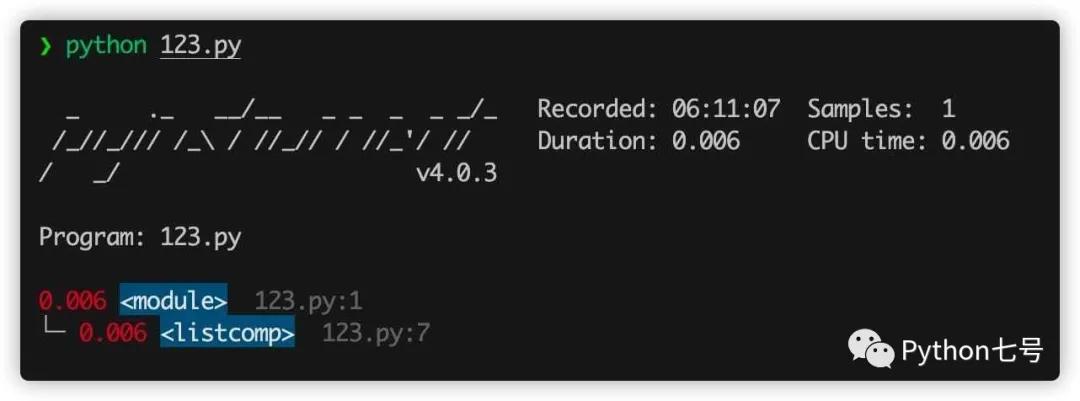
比如這段代碼 123.py,我們可以清楚的看到是列表推導式比較慢:
- from pyinstrument import Profiler
- profiler = Profiler()
- profiler.start()
- # 這里是你要分析的代碼
- a = [i for i in range(100000)]
- b = (i for i in range(100000))
- profiler.stop()
- profiler.print()
上述分析需要修改源代碼,如果你使用命令行工具,就不需要修改源代碼,只需要執行 pyinstrument xxxx.py 即可:
比如有這樣一段排序的程序 c_sort.py:
- import sys
- import time
- import numpy as np
- arr = np.random.randint(0, 10, 10)
- def slow_key(el):
- time.sleep(0.01)
- return el
- arr = list(arr)
- for i in range(10):
- arr.sort(key=slow_key)
- print(arr)
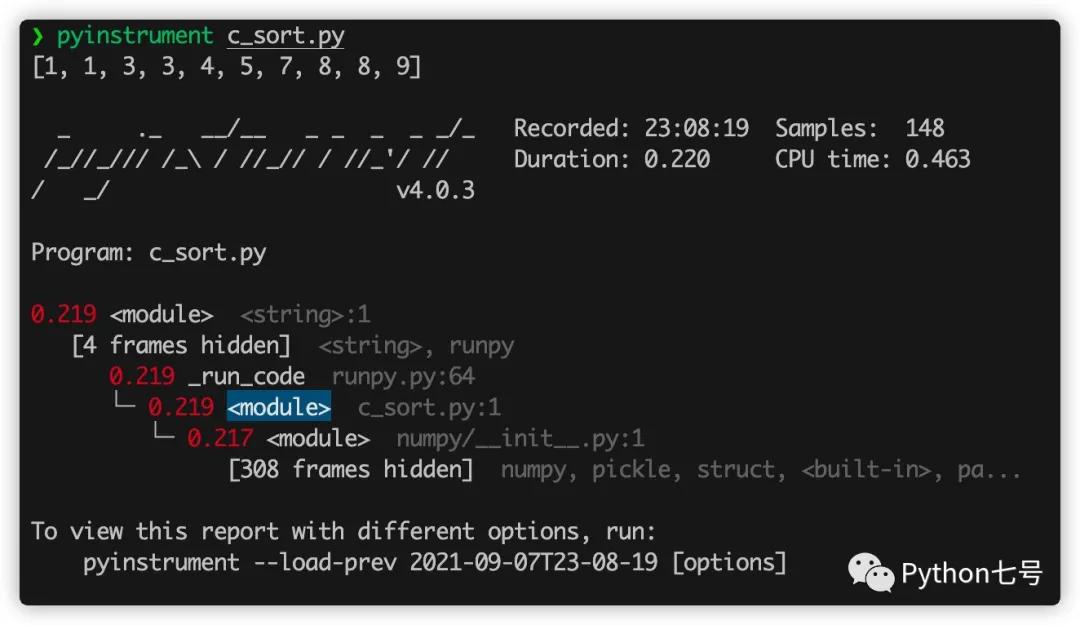
這段代碼里面故意放了一句 time.sleep(0.01) 來延遲性能,看看 pyinstrument 能否識別,命令行執行 pyinstrument c_sort.py:
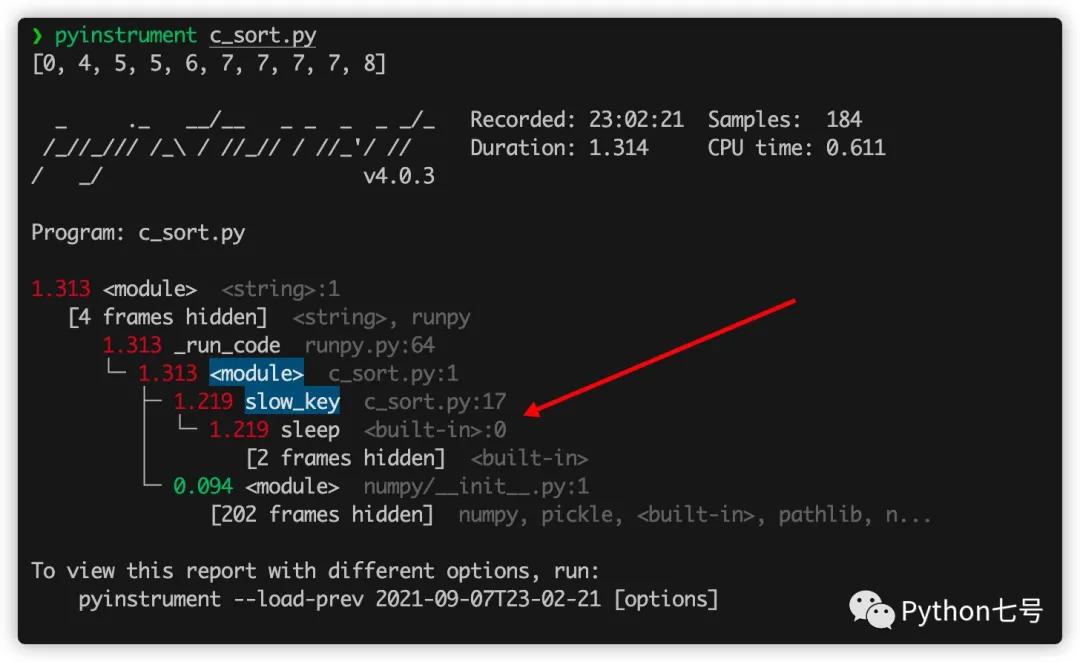
從結果來看,程序運行了 1.313 秒,而 sleep 就運行了 1.219 秒,很明顯是瓶頸,現在我們把它刪除,再看看結果:
刪除之后,性能最慢的就是 numpy 模塊的初始化代碼 __init__.py了,不過這些代碼不是自己寫的,而且并不是特別慢,就不需要去關心了。
分析 Flask 代碼
Web 應用也可以使用這個來找出性能瓶頸,比如 flask,只需要在請求之前記錄時間,在請求之后統計時間,只需要在 flask 的請求攔截器里面這樣寫:
- from flask import Flask, g, make_response, request
- app = Flask(__name__)
- @app.before_request
- def before_request():
- if "profile" in request.args:
- g.profiler = Profiler()
- g.profiler.start()
- @app.after_request
- def after_request(response):
- if not hasattr(g, "profiler"):
- return response
- g.profiler.stop()
- output_html = g.profiler.output_html()
- return make_response(output_html)
假如有這樣一個 API:
- @app.route("/dosomething")
- def do_something():
- import requests
- requests.get("http://google.com")
- return "Google says hello!"
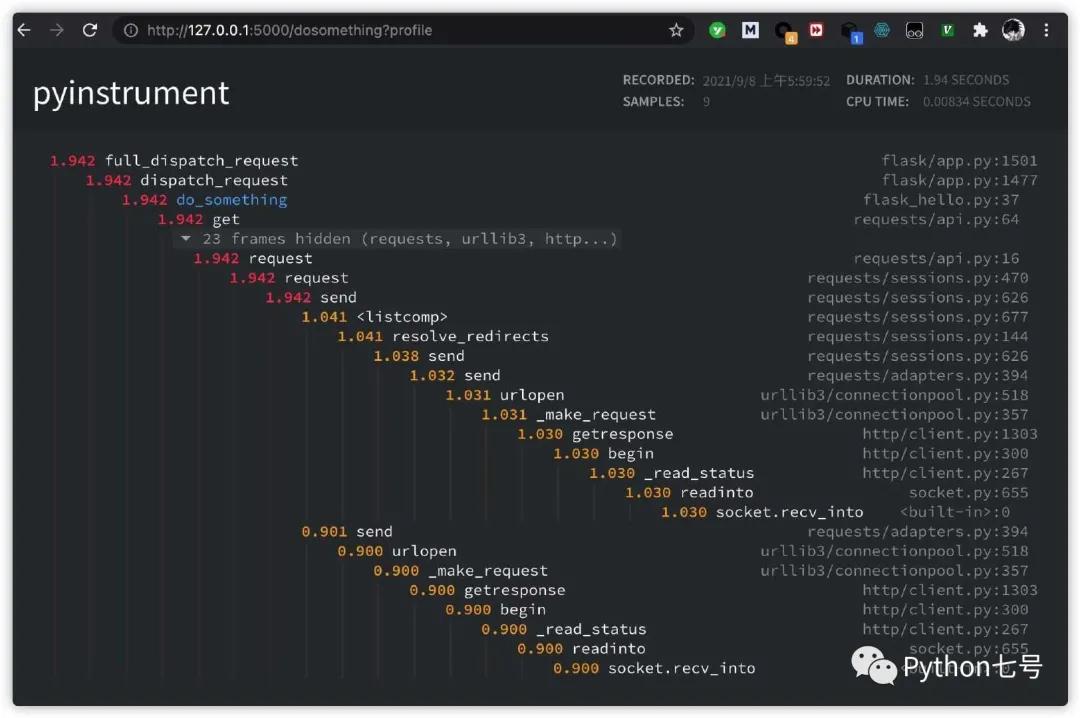
為了測試這個 API 的瓶頸,我們可以在 url 上加一個參數 profile 就可以:http://127.0.0.1:5000/dosomething?profile,哪一行代碼執行比較慢,結果清晰可見:
分析 Django 代碼
分析 Django 代碼也非常簡單,只需要在 Django 的配置文件的 MIDDLEWARE 中添加
- "pyinstrument.middleware.ProfilerMiddleware",
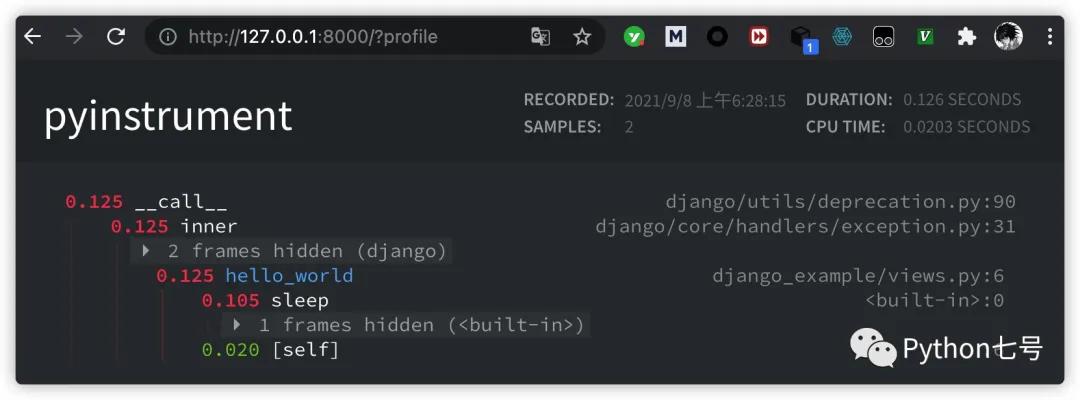
然后就可以在 url 上加一個參數 profile 就可以:
如果你不希望所有人都能看到,只希望管理員可以看到,settings.py 可以添加這樣的代碼:
- def custom_show_pyinstrument(request):
- return request.user.is_superuser
- PYINSTRUMENT_SHOW_CALLBACK = "%s.custom_show_pyinstrument" % __name__
如果不想通過 url 后面加參數的方式查看性能分析,可以在 settings.py 文件中添加:
- PYINSTRUMENT_PROFILE_DIR = 'profiles'
這樣,每次訪問一次 Django 接口,就會將分析結果以 html 文件形式保存在 項目目錄下的 profiles 文件夾中。
分析異步代碼
簡單的異步代碼分析:
- import asyncio
- from pyinstrument import Profiler
- async def main():
- p = Profiler()
- with p:
- print("Hello ...")
- await asyncio.sleep(1)
- print("... World!")
- p.print()
- asyncio.run(main())
復雜一些的異步代碼分析:
- import asyncio
- import time
- import pyinstrument
- def do_nothing():
- pass
- def busy_wait(duration):
- end_time = time.time() + duration
- while time.time() < end_time:
- do_nothing()
- async def say(what, when, profile=False):
- if profile:
- p = pyinstrument.Profiler()
- p.start()
- busy_wait(0.1)
- sleep_start = time.time()
- await asyncio.sleep(when)
- print(f"slept for {time.time() - sleep_start:.3f} seconds")
- busy_wait(0.1)
- print(what)
- if profile:
- p.stop()
- p.print(show_all=True)
- loop = asyncio.get_event_loop()
- loop.create_task(say("first hello", 2, profile=True))
- loop.create_task(say("second hello", 1, profile=True))
- loop.create_task(say("third hello", 3, profile=True))
- loop.run_forever()
- loop.close()
工作原理
Pyinstrument 每 1ms 中斷一次程序,并在該點記錄整個堆棧。它使用 C 擴展名和 PyEval_SetProfile 來做到這一點,但只每 1 毫秒讀取一次讀數。你可能覺得報告的樣本數量有點少,但別擔心,它不會降低準確性。默認間隔 1ms 是記錄堆棧幀的下限,但如果在單個函數調用中花費了很長時間,則會在該調用結束時進行記錄。如此有效地將這些樣本“打包”并在最后記錄。
Pyinstrument 是一個統計分析器,并不跟蹤,它不會跟蹤您的程序進行的每個函數調用。相反,它每 1 毫秒記錄一次調用堆棧。與其他分析器相比,統計分析器的開銷比跟蹤分析器低得多。
比如說,我想弄清楚為什么 Django 中的 Web 請求很慢。如果我使用 cProfile,我可能會得到這個:
- 151940 function calls (147672 primitive calls) in 1.696 seconds
- Ordered by: cumulative time
- ncalls tottime percall cumtime percall filename:lineno(function)
- 1 0.000 0.000 1.696 1.696 profile:0(<code object <module> at 0x1053d6a30, file "./manage.py", line 2>)
- 1 0.001 0.001 1.693 1.693 manage.py:2(<module>)
- 1 0.000 0.000 1.586 1.586 __init__.py:394(execute_from_command_line)
- 1 0.000 0.000 1.586 1.586 __init__.py:350(execute)
- 1 0.000 0.000 1.142 1.142 __init__.py:254(fetch_command)
- 43 0.013 0.000 1.124 0.026 __init__.py:1(<module>)
- 388 0.008 0.000 1.062 0.003 re.py:226(_compile)
- 158 0.005 0.000 1.048 0.007 sre_compile.py:496(compile)
- 1 0.001 0.001 1.042 1.042 __init__.py:78(get_commands)
- 153 0.001 0.000 1.036 0.007 re.py:188(compile)
- 106/102 0.001 0.000 1.030 0.010 __init__.py:52(__getattr__)
- 1 0.000 0.000 1.029 1.029 __init__.py:31(_setup)
- 1 0.000 0.000 1.021 1.021 __init__.py:57(_configure_logging)
- 2 0.002 0.001 1.011 0.505 log.py:1(<module>)
看完是不是還是一臉懵逼,通常很難理解您自己的代碼如何與這些跟蹤相關聯。Pyinstrument 記錄整個堆棧,因此跟蹤昂貴的調用要容易得多。它還默認隱藏庫框架,讓您專注于影響性能的應用程序/模塊:
- _ ._ __/__ _ _ _ _ _/_ Recorded: 14:53:35 Samples: 131
- /_//_/// /_\ / //_// / //_'/ // Duration: 3.131 CPU time: 0.195
- / _/ v3.0.0b3
- Program: examples/django_example/manage.py runserver --nothreading --noreload
- 3.131 <module> manage.py:2
- └─ 3.118 execute_from_command_line django/core/management/__init__.py:378
- [473 frames hidden] django, socketserver, selectors, wsgi...
- 2.836 select selectors.py:365
- 0.126 _get_response django/core/handlers/base.py:96
- └─ 0.126 hello_world django_example/views.py:4
最后的話
本文分享了 pyinstrument 的用法,有了這個性能分析神器,以后優化代碼可以節省很多時間了,這樣的效率神器很值得分享,畢竟人生苦短,能多點時間干點有意思的不香么?
本文轉載自微信公眾號「Python七號」,可以通過以下二維碼關注。轉載本文請聯系Python七號公眾號。