開發一個接口監控的Prometheus Exporter

想必大家對于黑盒監控都不陌生,我們經常使用blackbox_exporter來進行黑盒監控,在K8s中進行黑盒監控可以參考這里。
既然已經有成熟的工具,為何自己還要再來嘗試開發一個?
我說是為了學習,你信嗎?
既然是為了學習,整體邏輯就不用太復雜,主要需要實現以下功能:
- 可以通過配置文件的方式增加監控項
- 吐出Prometheus可收集指標
- 支持tcp和http探測
- 支持配置檢測頻率
寫在前面
在正式開始之前,先簡單介紹一下Prometheus以及Prometheus Exporter。
Prometheus是CNCF的一個開源監控工具,是近幾年非常受歡迎的開源項目之一。在云原生場景下,經常使用它來進行指標監控。
Prometheus支持4種指標類型:
- Counter(計數器):只增不減的指標,比如請求數,每來一個請求,該指標就會加1。
- Gauge(儀表盤):動態變化的指標,比如CPU,可以看到它的上下波動。
- Histogram(直方圖):數據樣本分布情況的指標,它將數據按Bucket進行劃分,并計算每個Bucket內的樣本的一些統計信息,比如樣本總量、平均值等。
- Summary(摘要):類似于Histogram,也用于表示數據樣本的分布情況,但同時展示更多的統計信息,如樣本數量、總和、平均值、上分位數、下分位數等。
在實際使用中,常常會將這些指標組合起來使用,以便能更好的觀測系統的運行狀態和性能指標。
這些指標從何而來?
Prometheus Exporter就是用來收集和暴露指標的工具,通常情況下是Prometheus Exporter收集并暴露指標,然后Prometheus收集并存儲指標,使用Grafana或者Promethues UI可以查詢并展示指標。
Prometheus Exporter主要包含兩個重要的組件:
- Collector:收集應用或者其他系統的指標,然后將其轉化為Prometheus可識別收集的指標。
- Exporter:它會從Collector獲取指標數據,并將其轉成為Prometheus可讀格式。
那Prometheus Exporter是如何生成Prometheus所支持的4種類型指標(Counter、Gauge、Histogram、Summary)的呢?
Prometheus提供了客戶端包github.com/prometheus/client_golang,通過它可以聲明不通類型的指標,比如:
import (
 "net/http"

 "github.com/prometheus/client_golang/prometheus"
 "github.com/prometheus/client_golang/prometheus/promhttp"
)

func main() {
 // 創建一個Counter指標
 counterMetric := prometheus.NewCounter(prometheus.CounterOpts{
  Name: "example_counter", // 指標名稱
  Help: "An example counter metric.", // 指標幫助信息
 })

 // 注冊指標
 prometheus.MustRegister(counterMetric)

 // 增加指標值
 counterMetric.Inc()

 // 創建一個HTTP處理器來暴露指標
 http.Handle("/metrics", promhttp.Handler())

 // 啟動Web服務器
 http.ListenAndServe(":8080", nil)
}import (
"net/http"
"github.com/prometheus/client_golang/prometheus"
"github.com/prometheus/client_golang/prometheus/promhttp"
)
func main() {
// 創建一個Gauge指標
guageMetric := prometheus.NewGauge(prometheus.GaugeOpts{
Name: "example_gauge", // 指標名稱
Help: "An example gauge metric.", // 指標幫助信息
})
// 注冊指標
prometheus.MustRegister(guageMetric)
// 設置指標值
guageMetric.Set(100)
// 創建一個HTTP處理器來暴露指標
http.Handle("/metrics", promhttp.Handler())
// 啟動Web服務器
http.ListenAndServe(":8080", nil)
}import (
"math/rand"
"net/http"
"time"
"github.com/prometheus/client_golang/prometheus"
"github.com/prometheus/client_golang/prometheus/promhttp"
)
func main() {
// 創建一個Histogram指標
histogramMetric := prometheus.NewHistogram(prometheus.HistogramOpts{
Name: "example_histogram", // 指標名稱
Help: "An example histogram metric.", // 指標幫助信息
Buckets: prometheus.LinearBuckets(0, 10, 10), // 設置桶寬度
})
// 注冊指標
prometheus.MustRegister(histogramMetric)
// 定期更新指標值
go func() {
for {
time.Sleep(time.Second)
histogramMetric.Observe(rand.Float64() * 100)
}
}()
// 創建一個HTTP處理器來暴露指標
http.Handle("/metrics", promhttp.Handler())
// 啟動Web服務器
http.ListenAndServe(":8080", nil)
}import (
"math/rand"
"net/http"
"time"
"github.com/prometheus/client_golang/prometheus"
"github.com/prometheus/client_golang/prometheus/promhttp"
)
func main() {
// 創建一個Summary指標
summaryMetric := prometheus.NewSummary(prometheus.SummaryOpts{
Name: "example_summary", // 指標名稱
Help: "An example summary metric.", // 指標幫助信息
Objectives: map[float64]float64{0.5: 0.05, 0.9: 0.01, 0.99: 0.001}, // 設置分位數和偏差
})
// 注冊指標
prometheus.MustRegister(summaryMetric)
// 定期更新指標值
go func() {
for {
time.Sleep(time.Second)
summaryMetric.Observe(rand.Float64() * 100)
}
}()
// 創建一個HTTP處理器來暴露指標
http.Handle("/metrics", promhttp.Handler())
// 啟動Web服務器
http.ListenAndServe(":8080", nil)
}上面的例子都是直接在創建指標的時候聲明了指標描述,我們也可以先聲明描述,再創建指標,比如:
import (
   "github.com/prometheus/client_golang/prometheus"
   "github.com/prometheus/client_golang/prometheus/promhttp"   "net/http")

// 1. 定義一個結構體,用于存放描述信息
type Exporter struct {
   summaryDesc *prometheus.Desc
}

// 2. 定義一個Collector接口,用于存放兩個必備函數,Describe和Collect
type Collector interface {
   Describe(chan<- *prometheus.Desc)
   Collect(chan<- prometheus.Metric)
}

// 3. 定義兩個必備函數Describe和Collect
func (e *Exporter) Describe(ch chan<- *prometheus.Desc) {
   // 將描述信息放入隊列
   ch <- e.summaryDesc
}

func (e *Exporter) Collect(ch chan<- prometheus.Metric) {
   //  采集業務指標數據
   ch <- prometheus.MustNewConstSummary(
      e.summaryDesc, // 將指標數據與自定義描述信息綁定
      4711, 403.34,  //  是該指標數據的值,這里表示該 Summary 指標的計數值和總和值。
      map[float64]float64{0.5: 42.3, 0.9: 323.3}, // 是一個 map,其中包含了 Summary 指標的 quantile 值及其對應的值。例如,0.5 表示 50% 的樣本值處于這個值以下,0.9 表示 90% 的樣本值處于這個值以下
      "200", "get", // 是指標的標簽值,用于標識和區分指標實例的特征。這些標簽值與在 NewExporter 中創建的 prometheus.NewDesc 函數的第三個參數相對應。
   )
}

// 4. 定義一個實例化函數,用于生成prometheus數據
func NewExporter() *Exporter {
   return &Exporter{
      summaryDesc: prometheus.NewDesc(
         "example_summary",                   // 指標名
         "An example summary metric.",        // 幫助信息
         []string{"code", "method"},          // 變量標簽名,值是可變的
         prometheus.Labels{"owner": "joker"}, // 常量標簽,固定的
      ),
   }
}

func main() {
   // 實例化exporter
   exporter := NewExporter()

   // 注冊指標
   prometheus.MustRegister(exporter)

   // 創建一個HTTP處理器來暴露指標
   http.Handle("/metrics", promhttp.Handler())

   // 啟動Web服務器
   http.ListenAndServe(":8080", nil)
}
通過上面的介紹,對于怎么創建一個Prometheus Exporter是不是有了初步的了解?主要可分為下面幾步:
- 定義一個Exporter結構體,用于存放描述信息
- 實現Collector接口
- 實例化exporter
- 注冊指標
- 暴露指標
現在開始
有了一定的基本知識后,我們開始開發自己的Exporter。
我們再來回顧一下需要實現的功能:
- 可以通過配置文件的方式增加監控項
- 吐出Prometheus可收集指標
- 支持tcp和http探測
- 支持配置檢測頻率
(1)我們的采集對象是通過配置文件加載的,所以我們可以先確定配置文件的格式,我希望的是如下格式:
- url: "http://www.baidu.com"
  name: "百度測試"
  protocol: "http"
  check_interval: 2s
- url: "localhost:2222"
  name: "本地接口2222檢測"
  protocol: "tcp"
其中check_interval是檢測頻率,如果不寫,默認是1s。
我們需要解析配置文件里的內容,所以需要先定義配置文件的結構體,如下:
// InterfaceConfig 定義接口配置結構
type InterfaceConfig struct {
   Name          string        `yaml:"name"`
   URL           string        `yaml:"url"`
   Protocol      string        `yaml:"protocol"`
   CheckInterval time.Duration `yaml:"check_interval,omitempty"`
}
然后,我們使用的是yaml格式的配置文件,保存在config.yaml文件中,意味著我們需要解析config.yaml這個文件,然后再解析。
// loadConfig 從配置文件加載接口配置
func loadConfig(configFile string) ([]InterfaceConfig, error) {
   config := []InterfaceConfig{}

   // 從文件加載配置
   data, err := ioutil.ReadFile(configFile)
   if err != nil {
      return nil, err
   }

   // 解析配置文件
   err = yaml.Unmarshal(data, &config)
   if err != nil {
      return nil, err
   }

   // 設置默認的檢測時間間隔為1s
   for i := range config {
      if config[i].CheckInterval == 0 {
         config[i].CheckInterval = time.Second
      }
   }

   return config, nil
}
因為監控對象可以是多個,所以使用[]InterfaceConfig{}來保存多個對象。
(2)定義接口探測的Collector接口,實現Promethues Collector接口
type HealthCollector struct {
   interfaceConfigs []InterfaceConfig
   healthStatus     *prometheus.Desc
}
這里將配置文件也放進去,期望在初始化HealthCollector的時候將配置文件一并加載了。
// NewHealthCollector 創建HealthCollector實例
func NewHealthCollector(configFile string) (*HealthCollector, error) {
   // 從配置文件加載接口配置
   config, err := loadConfig(configFile)
   if err != nil {
      return nil, err
   }

   // 初始化HealthCollector
   collector := &HealthCollector{
      interfaceConfigs: config,
      healthStatus: prometheus.NewDesc(
         "interface_health_status",
         "Health status of the interfaces",
         []string{"name", "url", "protocol"},
         nil,      ),
   }

   return collector, nil
}
在這里定義了[]string{"name", "url", "protocol"}動態標簽,方便使用PromQL查詢指標和做監控告警。
(3)實現Prometheus Collector接口的Describe和Collect方法
// Describe 實現Prometheus Collector接口的Describe方法
func (c *HealthCollector) Describe(ch chan<- *prometheus.Desc) {
   ch <- c.healthStatus
}

// Collect 實現Prometheus Collector接口的Collect方法
func (c *HealthCollector) Collect(ch chan<- prometheus.Metric) {
   var wg sync.WaitGroup

   for _, iface := range c.interfaceConfigs {
      wg.Add(1)

      go func(iface InterfaceConfig) {
         defer wg.Done()

         // 檢測接口健康狀態
         healthy := c.checkInterfaceHealth(iface)

         // 創建Prometheus指標
         var metricValue float64
         if healthy {
            metricValue = 1
         } else {
            metricValue = 0
         }
         ch <- prometheus.MustNewConstMetric(
            c.healthStatus,
            prometheus.GaugeValue,
            metricValue,
            iface.Name,
            iface.URL,
            iface.Protocol,
         )
      }(iface)
   }

   wg.Wait()
}
在Collect方法中,我們通過checkInterfaceHealth來獲取檢測對象的監控狀態,然后創建Prometheus對應的指標,這里規定1就是存活狀態,0就是異常狀態。
(4)實現http和tcp檢測方法
// checkInterfaceHealth 檢測接口健康狀態
func (c *HealthCollector) checkInterfaceHealth(iface InterfaceConfig) bool {
   switch iface.Protocol {
   case "http":
      return c.checkHTTPInterfaceHealth(iface)
   case "tcp":
      return c.checkTCPInterfaceHealth(iface)
   default:
      return false
   }
}

// checkHTTPInterfaceHealth 檢測HTTP接口健康狀態
func (c *HealthCollector) checkHTTPInterfaceHealth(iface InterfaceConfig) bool {
   client := &http.Client{
      Timeout: 5 * time.Second,
   }

   resp, err := client.Get(iface.URL)
   if err != nil {
      return false
   }
   defer resp.Body.Close()

   return resp.StatusCode == http.StatusOK
}

// checkTCPInterfaceHealth 檢測TCP接口健康狀態
func (c *HealthCollector) checkTCPInterfaceHealth(iface InterfaceConfig) bool {
   conn, err := net.DialTimeout("tcp", iface.URL, 5*time.Second)
   if err != nil {
      return false
   }
   defer conn.Close()

   return true
}
http和tcp的檢測方法這里比較粗暴,http的就請求一次查看狀態碼,tcp的就檢查能不能建立連接。
(5)創建main方法,完成開發。
func main() {
   // 解析命令行參數
   configFile := flag.String("config", "", "Path to the config file")
   flag.Parse()

   if *configFile == "" {
      // 默認使用當前目錄下的config.yaml
      *configFile = "config.yaml"
   }

   // 加載配置文件
   collector, err := NewHealthCollector(*configFile)
   if err != nil {
      fmt.Println("Failed to create collector:", err)
      return
   }

   // 注冊HealthCollector
   prometheus.MustRegister(collector)

   // 啟動HTTP服務,暴露Prometheus指標
   http.Handle("/metrics", promhttp.Handler())
   err = http.ListenAndServe(":2112", nil)
   if err != nil {
      fmt.Println("Failed to start HTTP server:", err)
      os.Exit(1)
   }
}
在這里增加了解析命令行參數,支持通過--config的方式來指定配置文件,如果不指定默認使用config.yaml。
到這里就開發完了,雖然沒有嚴格在寫在前面中梳理的開發步驟,但是整體大差不差。
應用部署
開發出來的東西如果不上線,那就等于沒做,你的KPI是0,領導才不關心你做事的過程,只看結果。所以不論好或是不好,先讓它跑起來才是真的好。
(1)編寫Dockerfile,當然要用容器來運行應用了。
FROM golang:1.19 AS build-env
ENV GOPROXY https://goproxy.cn
ADD . /go/src/app
WORKDIR /go/src/app
RUN go mod tidy
RUN GOOS=linux GOARCH=386 go build -v -o /go/src/app/go-interface-health-check

FROM alpine
COPY --from=build-env /go/src/app/go-interface-health-check /usr/local/bin/go-interface-health-check
COPY --from=build-env /go/src/app/config.yaml /opt/
WORKDIR /opt
EXPOSE 2112
CMD [ "go-interface-health-check","--config=/opt/config.yaml" ]
(2)編寫docker-compose配置文件,這里直接使用docker-compose部署,相比K8s的yaml來說更簡單快捷。
version: '3.8'
services:
  haproxy:
    image: go-interface-health-check:v0.3
    container_name: interface-health-check
    network_mode: host
    restart: unless-stopped
    command: [ "go-interface-health-check","--config=/opt/config.yaml" ]
    volumes:
      - /u01/interface-health-check:/opt
      - /etc/localtime:/etc/localtime:ro
    user: root
    logging:
      driver: json-file
      options:
        max-size: 20m
        max-file: 100
使用docker-compose up -d運行容器后,就可以使用curl http://127.0.0.1:2112/metrics查看指標。

收集展示
Prometheus的搭建這里不再演示,如果有不清楚的,可以移步這里。
在Prometheus里配置抓取指標的配置:
scrape_configs:
      - job_name: 'interface-health-check'
        static_configs:
          - targets: ['127.0.0.1:2112']
配置完重載prometheus,可以查看抓取的target是否存活。

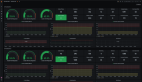
最后,為了方便展示,可以創建一個Grafana面板,比如:
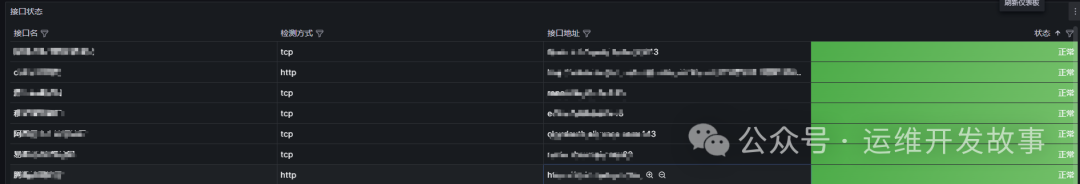
當然,可以根據需要創建告警規則,當interface_health_status==0表示接口異常。
最后
以上就完成了自己開發一個Prometheus Exporter,上面的例子寫的比較簡單粗暴,可以根據實際情況來進行調整。
前兩天刷到馮唐的一句話:“越是底層的人,處理人際關系的能力就越差,你越往上走,你就會發現,你以為人家天天在研究事,其實他們在研究人。”
你怎么理解這句話?
鏈接
[1] https://www.yuque.com/coolops/kubernetes/dff1cg。
[2] https://www.yuque.com/coolops/kubernetes/wd2vts。
[3] https://github.com/prometheus/client_golang/blob/main/prometheus/examples_test.go。
[4] https://www.cnblogs.com/0x00000/p/17557743.html。