探索 Prometheus Agent + GreptimeDB:輕量級監(jiān)控的未來
引言
緊接上篇的文章,我們繼續(xù)往上蓋大樓,現(xiàn)在我們已經(jīng)蓋到了第 500 樓了,不要往下看,除非你是勇者,不然你會嚇到你自己。
這一篇的東西也是挺多的:Prometheus Agent。
Prometheus 一直是 Kubernetes 生態(tài)中不可或缺的監(jiān)控工具。然而,隨著分布式系統(tǒng)的復(fù)雜性增加以及邊緣計算、Serverless 技術(shù)的廣泛應(yīng)用,傳統(tǒng)的 Prometheus Server 已不再適合所有場景。為了應(yīng)對這些挑戰(zhàn),Prometheus 引入了一種輕量級運行模式:Prometheus Agent。
Prometheus Agent 專注于指標的采集和推送,省去了存儲和查詢的功能,使其在資源受限的環(huán)境中更加高效。
本文將詳細介紹 Prometheus Agent 的運行機制、使用場景以及部署方式,并分享一些最佳實踐。
介紹
什么是 Prometheus Agent?
Prometheus Agent 是 Prometheus 自 v2.33.0 版本起引入的一種運行模式,其主要特點包括:
- ? 輕量化:專注于數(shù)據(jù)的采集與推送,不存儲數(shù)據(jù),也不提供查詢能力。
- ? 高效:減少了本地存儲和查詢相關(guān)的資源占用。
- ? 推送模式:通過 remote_write 將采集到的指標推送到遠程存儲或中央 Prometheus Server。
這種模式特別適合邊緣場景、Serverless 環(huán)境以及需要集中化監(jiān)控的分布式系統(tǒng)。
Prometheus Agent 的適用場景
邊緣計算
在邊緣計算場景中,設(shè)備通常資源有限,難以運行完整的 Prometheus Server。Prometheus Agent 通過其輕量化特性,可以高效采集邊緣設(shè)備的指標,并將數(shù)據(jù)推送到中央監(jiān)控系統(tǒng)。
Serverless 環(huán)境
對于 Serverless 服務(wù)(如函數(shù)計算、API 網(wǎng)關(guān)等),Prometheus Agent 可以動態(tài)采集相關(guān)指標,并避免因存儲和查詢功能導(dǎo)致的資源浪費。
集中式監(jiān)控
在大型分布式系統(tǒng)中,可通過在每個子系統(tǒng)中部署 Prometheus Agent,將所有數(shù)據(jù)集中推送到遠程存儲(如 Cortex、Thanos),實現(xiàn)統(tǒng)一的存儲與查詢。
高性能監(jiān)控
對于大規(guī)模集群,Agent 模式可減少單點 Prometheus Server 的負載,將存儲和查詢功能卸載到遠程存儲。
為什么需要 Prometheus Agent
Prometheus Agent 其實只是 Prometheus 的一種特殊運行狀態(tài),在 prometheus-operator 中以 PrometheusAgent 這個 CRD 體現(xiàn),但其內(nèi)部控制邏輯與 Prometheus CRD 一致。
之所以需要 Prometheus Agent,我們其實可以從 Prometheus 的官方文檔[1]一窺究竟。Prometheus Agent 本質(zhì)上就是將時序數(shù)據(jù)庫能力從 Prometheus 中剝離,并優(yōu)化 Remote Write 性能,從而讓其成為了一個支持 Prometheus 采集語義的高性能 Agent。這樣一來,Prometheus Agent 還可以部署在一些資源受限的邊緣場景進行數(shù)據(jù)采集。
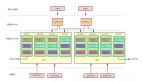
“眾所周知”,Prometheus 作為數(shù)據(jù)庫而言,查詢性能和可擴展性相對較弱,這也是為什么 Remote Write 會如此流行以至于又成為了一個事實上的標準:因為大家都希望將數(shù)據(jù)轉(zhuǎn)存在性能更高的數(shù)據(jù)庫上但又希望繼續(xù)兼容 Prometheus 的采集邏輯(因為很好用)。Agent 模式其實如大家所意,禁用了查詢、報警和本地存儲功能,并用了一個特殊的 TSDB WAL 來臨時存儲數(shù)據(jù),從而整體架構(gòu)如下所示:
 圖片
圖片
這種架構(gòu)某種程度是推拉結(jié)合的模式。Metrics 的采集采用 Pull 模式,而其存儲則采用 Push 模式。對于高吞吐的寫入,Push 模式其實對寫入更友好。因為我們總是可以以 Batch 模式來集中向遠端寫入大批數(shù)據(jù)。這種模式下的 Prometheus 其實是無狀態(tài),更便于部署和 Scrape Job 的分片。
其實,這類兼容 Prometheus 采集語義的 Agent 社區(qū)有不少可供選擇,比如 vmagent[2] 和 vector[3]。VictoriaMetrics 還曾經(jīng)對 Prometheus Agent, vmagant 和 Grafana Agant 做過一個性能報告[4]。不過很快,Grafana Agent 就停止開發(fā)并轉(zhuǎn)成維護模式[5]。Grafana 又造了另一個項目 Alloy[6],重點支持 OpenTelemetry,當(dāng)然又造了一個與 Terraform 語法酷似的配置語言的 DSL。
從長期技術(shù)演技來看,Agent 總是兵家必爭之地,因為可以守住數(shù)據(jù)入口可以做的事情比較多。大家總是希望 Agent 能:
? 具有極低的 CPU 和 Memory footprint,因為它們通常會以 sidecar 或者 daemonset 的形式進行部署,資源極度受限;
? 兼容更多的前端采集協(xié)議和后端寫入邏輯;
? 具備一定的數(shù)據(jù)的編排能力(或者稱為 pipeline ?),即采集后的數(shù)據(jù)能以一定的規(guī)則進行改寫和轉(zhuǎn)換;
? 技術(shù)中立;
Prometheus Agent 數(shù)據(jù)采集工作流程
采集目標的發(fā)現(xiàn):
? 如果你使用 scrape_configs,Agent 會直接按照配置中的 targets 抓取數(shù)據(jù)。
? 如果你使用 ServiceMonitor 或 PodMonitor,Agent 會通過 Prometheus Operator 的自動發(fā)現(xiàn)機制,找到符合條件的服務(wù)或 Pod(我們使用這種方式)。 數(shù)據(jù)采集:
? Prometheus Agent 會周期性地訪問這些目標的 /metrics 端點,抓取指標數(shù)據(jù)。 數(shù)據(jù)推送:
? Agent 使用 remote_write 將采集到的指標數(shù)據(jù)推送到遠程存儲(例如 Prometheus Server 或 GreptimeDB)。
開始
與 GreptimeDB 的集成
GreptimeDB[7] 作為一個新款的開源 TSDB 很早就支持了 Prometheus Remote Write[8]。我們其實可以直接使用 PrometheusAgent 這個 CRD 來定義基于 GreptimeDB Remote Write 的 Prometheus Agent。這樣以來,用戶其實無需做過多 CR 的改動就能直接將數(shù)據(jù)接入到 GreptimeDB 中。
這邊的思路是所有的數(shù)據(jù)都存儲在 遠程存儲 中,Prometheus 本身不存儲數(shù)據(jù)
部署 greptimedb-operator[9]
helm repo add greptime https://greptimeteam.github.io/helm-charts/
helm repo update

helm upgrade \
  --install \
  --create-namespace \
  greptimedb-operator greptime/greptimedb-operator \
  -n greptimedb
greptimedb-operator[10] 同時支持管理 GreptimeDB Standalone 和 Cluster 模式,用戶可以根據(jù)自己需要創(chuàng)建相應(yīng)的 CR。
快速啟動一個 Standalone 模式下的 GreptimeDB
用的資源比較多,畢竟需要存儲大量數(shù)據(jù),還要被 Prometheus 讀取
apiVersion: greptime.io/v1alpha1
kind: GreptimeDBStandalone
metadata:
  name: greptimedb
  namespace: greptimedb-admin
spec:
  base:
    main:
      image: greptime/greptimedb:latest
      resources:
        limits:
          cpu: "4"
          memory: "7Gi"
        requests:
          cpu: "2"
          memory: "4Gi"
我們可以通過觀察 GreptimeDBStandalone 的狀態(tài)來判斷其是否啟動成功:
$ kubectl get all
NAME                             READY   STATUS    RESTARTS   AGE
pod/greptimedb-standalone-0   1/1     Running   0          23s

NAME                               TYPE        CLUSTER-IP        EXTERNAL-IP   PORT(S)                               AGE
service/kubernetes                 ClusterIP   192.168.194.129   <none>        443/TCP                               36d
service/greptimedb-standalone   ClusterIP   192.168.194.245   <none>        4001/TCP,4000/TCP,4002/TCP,4003/TCP   23s

NAME                                        READY   AGE
statefulset.apps/greptimedb-standalone   1/1     23s
Ingress:
apiVersion: networking.k8s.io/v1
kind: Ingress
metadata:
  name: greptimedb
  namespace: greptimedb-admin
spec:
  ingressClassName: nginx
  rules:
    - http:
        paths:
          - path: /
            pathType: Prefix
            backend:
              service:
                name: greptimedb-standalone
                port:
                  name: http
      host: greptimedb.kubernetes.click
優(yōu)化 GreptimeDB 的配置文件:
jacobleo@Jacobs-MacBook-Air greptimedb % kgcm -ngreptimedb-admin
NAME                    DATA   AGE
kube-root-ca.crt        1      4d18h
greptimedb-standalone   1      50m

jacobleo@Jacobs-MacBook-Air greptimedb % k edit cm greptimedb-standalone -ngreptimdb-admin
# Please edit the object below. Lines beginning with a '#' will be ignored,
# and an empty file will abort the edit. If an error occurs while saving this file will be
# reopened with the relevant failures.
#
apiVersion: v1
data:
  config.toml: |2

    [logging]
      dir = "/data/greptimedb/logs"
      level = "debug" # 我們這里先改成 degub,獲取更多的信息,生產(chǎn)建議使用 info 或者 warn
      log_format = "json" # 我們這里配置成 json,方便后面日志采集(ELK),或者其他之類的

    [storage]
      data_home = "/data/greptimedb"
      ttl = 27 # 我們這里配置了數(shù)據(jù)的保留天數(shù)

    [wal]
      dir = "/data/greptimedb/wal"
kind: ConfigMap
metadata:
  annotations:
    controller.greptime.io/last-applied-resource-spec: '{"config.toml":"\n[logging]\n  dir
      = \"/data/greptimedb/logs\"\n  level = \"info\"\n  log_format = \"text\"\n\n[storage]\n  data_home
      = \"/data/greptimedb\"\n\n[wal]\n  dir = \"/data/greptimedb/wal\"\n"}'
  creationTimestamp: "2025-01-14T03:33:43Z"
  name: greptimedb-standalone
  namespace: greptimedb-admin
  ownerReferences:
  - apiVersion: greptime.io/v1alpha1
    blockOwnerDeletion: true
    controller: true
    kind: GreptimeDBStandalone
    name: greptimedb
    uid: 1ae5a33d-f260-48ad-b6ca-609c1cbb262a
  resourceVersion: "318496"
  uid: baa0588e-1ab6-4453-8e37-2f5ea2c1b00d
更改完成后,等待 Pod 重啟,如果不行,就手動重啟
數(shù)據(jù)可視化
自 GreptimeDB v0.2.0 版本以來,控制臺已經(jīng)默認嵌入到 GreptimeDB 的 binary 文件中。在啟動 GreptimeDB 單機版[11]或分布式集群[12]后,可以通過 URL http://localhost:4000/dashboard 訪問控制臺,我這邊使用的 Ingress。控制臺支持多種查詢語言,包括 SQL 查詢[13]和 PromQL 查詢[14]。
提供不同種類的圖表,可以根據(jù)不同的場景進行選擇。當(dāng)你有足夠的數(shù)據(jù)時,圖表的內(nèi)容將更加豐富。
 圖片
圖片
可以看到并沒有什么大問題,但是到后面我感覺到有一個 Bug,就是它有時候會莫名其妙地不能訪問(可能是我 Mac 本地環(huán)境的原因,我使用的 OrbStack[15](可以幫助我迅速啟動一個 K8s 集群, 只支持 Mac)),就是 404 Not Found,我后來就是在它的 YAML 文件換一下鏡像,然后重新部署就好了,很奇怪,當(dāng)時弄了半天。
看到這里,如果 GreptimeDB 的相關(guān)人員看到了,希望重視下這個問題。
創(chuàng)建 Promethus Agent 實例并將 Remote Write 設(shè)置為 GreptimeDB
apiVersion: v1
kind: ServiceAccount
metadata:
  name: prometheus-agent
  namespace: greptimedb-admin
---
apiVersion: rbac.authorization.k8s.io/v1
kind: ClusterRole
metadata:
  name: prometheus-agent
rules:
  - apiGroups: ["monitoring.coreos.com"]
    resources:
      - servicemonitors
      - podmonitors
      - prometheuses
    verbs: ["get", "list", "watch"]
  - apiGroups: [""]
    resources:
      - nodes
      - nodes/metrics
      - services
      - endpoints
      - pods
    verbs: ["get", "list", "watch"]
  - apiGroups: [""]
    resources:
      - configmaps
    verbs: ["get"]
  - apiGroups:
      - discovery.k8s.io
    resources:
      - endpointslices
    verbs: ["get", "list", "watch"]
  - apiGroups:
      - networking.k8s.io
    resources:
      - ingresses
    verbs: ["get", "list", "watch"]
  - nonResourceURLs: ["/metrics"]
    verbs: ["get"]
---
apiVersion: rbac.authorization.k8s.io/v1
kind: ClusterRoleBinding
metadata:
  name: prometheus-agent
roleRef:
  apiGroup: rbac.authorization.k8s.io
  kind: ClusterRole
  name: prometheus-agent
subjects:
  - kind: ServiceAccount
    name: prometheus-agent
    namespace: greptimedb-admin
---
apiVersion: monitoring.coreos.com/v1alpha1
kind: PrometheusAgent
metadata:
  name: prometheus-agent
  namespace: greptimedb-admin
spec:
  image: quay.io/prometheus/prometheus:v2.53.0
  replicas: 1
  serviceAccountName: prometheus-agent
這邊配置下 GreptimeDB,我是用 Ingress 給 GreptimeDB 做的域名解析,你自己可以選擇
·····
  enableFeatures:
    - agent  # 啟用 Prometheus Agent 模式
  remoteWrite:
    - url: http://greptimedb.kubernetes.click/v1/prometheus/write?db=public
      queueConfig:  # 可選配置,用于優(yōu)化數(shù)據(jù)發(fā)送性能
        capacity: 5000 # 緩沖區(qū)容量
        maxSamplesPerSend: 10000 # 每次發(fā)送的樣本數(shù)
        batchSendDeadline: 5s # 批量發(fā)送的最大等待時間
·····如果你想要更嚴謹?shù)卣胰ツ阆胍臄?shù)據(jù),可以使用下面的,你們需要替換你們自己的 Label
serviceMonitorSelector:
    matchExpressions:
      - key: app
        operator: In
        values:
          - frontend
          - backend
      - key: environment
        operator: NotIn
        values:
          - dev
  podMonitorSelector:
    matchExpressions:
      - key: team
        operator: Exists
  namespaceSelector:
    matchNames:
      - default
      - monitoring
serviceMonitorSelector 和 podMonitorSelector:Prometheus-Agent 會根據(jù)這些選擇器,動態(tài)發(fā)現(xiàn)并抓取符合條件的 ServiceMonitor 和 PodMonitor 還有 namespaceSelector 指定的指標。
matchExpressions 語法
? key: 標簽的名稱。
? operator:
a.In: 標簽值必須在 values 列表中。
b.NotIn: 標簽值不能在 values 列表中。
c.Exists: 標簽必須存在。
d.DoesNotExist: 標簽不能存在。
? values: 用于匹配的值列表(僅適用于 In 和 NotIn 操作符)。
示例邏輯
? 匹配 app 標簽的值是 frontend 或 backend。
? 排除 environment 標簽的值為 dev 的目標。
? 包含所有有 team 標簽的 PodMonitor。
namespaceSelector
? 限定匹配的命名空間,例如 default 和 monitoring。
但是如果你想要匹配所有的話,可以這樣:
serviceMonitorSelector: {}
  serviceMonitorNamespaceSelector: {}
  podMonitorNamespaceSelector: {}
  podMonitorSelector: {}
Resources 優(yōu)化
它占用的資源也是挺多的
resources:
    limits:
      cpu: "2"       # 最大可使用的 2 個 CPU
      memory: "4Gi"  # 最大可使用 4GB 內(nèi)存
    requests:
      cpu: "1"       # 最少需要 1 個 CPU
      memory: "2Gi"  # 最少需要 2GB 內(nèi)存
完整 YAML 文件
apiVersion: v1
kind: ServiceAccount
metadata:
  name: prometheus-agent
  namespace: greptimedb-admin
---
apiVersion: rbac.authorization.k8s.io/v1
kind: ClusterRole
metadata:
  name: prometheus-agent
rules:
  - apiGroups: ["monitoring.coreos.com"]
    resources:
      - servicemonitors
      - podmonitors
      - prometheuses
    verbs: ["get", "list", "watch"]
  - apiGroups: [""]
    resources:
      - nodes
      - nodes/metrics
      - services
      - endpoints
      - pods
    verbs: ["get", "list", "watch"]
  - apiGroups: [""]
    resources:
      - configmaps
    verbs: ["get"]
  - apiGroups:
      - discovery.k8s.io
    resources:
      - endpointslices
    verbs: ["get", "list", "watch"]
  - apiGroups:
      - networking.k8s.io
    resources:
      - ingresses
    verbs: ["get", "list", "watch"]
  - nonResourceURLs: ["/metrics"]
    verbs: ["get"]
---
apiVersion: rbac.authorization.k8s.io/v1
kind: ClusterRoleBinding
metadata:
  name: prometheus-agent
roleRef:
  apiGroup: rbac.authorization.k8s.io
  kind: ClusterRole
  name: prometheus-agent
subjects:
  - kind: ServiceAccount
    name: prometheus-agent
    namespace: greptimedb-admin
---
apiVersion: monitoring.coreos.com/v1alpha1
kind: PrometheusAgent
metadata:
  name: prometheus-agent
  namespace: greptimedb-admin
spec:
  image: quay.io/prometheus/prometheus:v2.53.0
  replicas: 1
  serviceAccountName: prometheus-agent
  enableFeatures:
    - agent
  remoteWrite:
    - url: "http://greptimedb.kubernetes.click/v1/prometheus/write?db=public"
      queueConfig:
        capacity: 5000
        maxSamplesPerSend: 10000
        batchSendDeadline: 5s
  serviceMonitorSelector: {}
  serviceMonitorNamespaceSelector: {}
  podMonitorNamespaceSelector: {}
  resources:
    limits:
      cpu: "2"
      memory: "4Gi"
    requests:
      cpu: "1"
      memory: "2Gi"
Apply
$ kubectl apply -f prom-agent.yaml我部署完成之后,就一直報錯,當(dāng)時很納悶:
 圖片
圖片
弄了半天,問題才發(fā)現(xiàn)是版本的問題。
我的 Prometheus-Operator 的 Prometheus 是 3.0.1 版本,而我的 Prometheus Agent 使用的版本是 2.53.0,所以,這邊把我的 Prometheus Agent 的版本改成和 Prometheus 的版本,就可以了。
$ kg all
NAME                                READY   STATUS    RESTARTS   AGE
pod/greptimedb-standalone-0      1/1     Running   0          122m
pod/prom-agent-prometheus-agent-0   2/2     Running   0          81s

NAME                                TYPE        CLUSTER-IP        EXTERNAL-IP   PORT(S)                               AGE
service/kubernetes                  ClusterIP   192.168.194.129   <none>        443/TCP                               36d
service/greptimedb-standalone    ClusterIP   192.168.194.178   <none>        4001/TCP,4000/TCP,4002/TCP,4003/TCP   122m
service/prometheus-agent-operated   ClusterIP   None              <none>        9090/TCP                              82s

NAME                                           READY   AGE
statefulset.apps/greptimedb-standalone      1/1     122m
statefulset.apps/prom-agent-prometheus-agent   1/1     81s
更新 Prometheus YAML 文件
我這邊使用的是 Prometheus-Operator 的 Github[16] 倉庫,這邊沒有使用 Helm 安裝,使用的 Manifest
····
  remoteWrite:     # 你這邊也可以設(shè)置成 remoteRead,取決于你什么場景,然后 url 后面的也要換了
    - url: "http://greptimedb.kubernetes.click/v1/prometheus/write?db=public"
      queueConfig:
        capacity: 5000
        maxSamplesPerSend: 10000
        batchSendDeadline: 5s
  retention: 1h # 將數(shù)據(jù)保留時間設(shè)置為最短
  scrapeInterval: 10s
  storage:
    volumeClaimTemplate:    # 我這里沒有指定 SC,如果沒有指定,它就會使用我安裝的默認的 SC
      spec:
        accessModes:
          - ReadWriteOnce
        resources:
          requests:
            storage: 1Gi
····
最后我們來看下我們上面兩個 Pod 的資源占用情況
jacobleo@Jacobs-MacBook-Air greptimedb % k top pod -ngreptimedb-admin
NAME                                   CPU(cores)   MEMORY(bytes)
greptimedb-operator-7c67868d4b-7vmtp   9m           71Mi
greptimedb-standalone-0                341m         5110Mi
prom-agent-prometheus-agent-0          72m          850Mi
可以看到,它們的資源占用還是挺夸張的
測試連接 GreptimeDB
安裝 MySQL 客戶端
我這邊使用的是 Mac
在 Linux
如果你使用的是 Ubuntu 或其他基于 Debian 的發(fā)行版:
sudo apt update
sudo apt install mysql-client -y
如果你使用的是 CentOS 或基于 RedHat 的發(fā)行版:
sudo yum install mysql -y在 macOS
你可以使用 Homebrew 來安裝:
brew install mysql-client注意:安裝完成后,可能需要將 MySQL 客戶端的路徑加入環(huán)境變量。運行以下命令:
echo 'export PATH="/usr/local/opt/mysql-client/bin:$PATH"' >> ~/.zshrc
source ~/.zshrc

sudo ln -s /opt/homebrew/Cellar/mysql-client/9.1.0/bin/mysql /usr/local/bin/mysql
在 Windows
? 下載并安裝 MySQL Shell 或 MySQL Workbench 客戶端工具。
? 官方下載鏈接:MySQL Community Downloads[17]
使用 MySQL 客戶端連接服務(wù)
一旦安裝完成,你可以通過以下命令連接到目標服務(wù):
通過 kubectl port-forward
確保你暴露了服務(wù)端口,例如:
kubectl port-forward service/greptimedb-standalone 4002:4002 -ngreptimedb-admin然后使用 MySQL 客戶端
mysql -h 127.0.0.1 -P 4002 -u root -p測試數(shù)據(jù)
mysql> show databases;
+--------------------+
| Database           |
+--------------------+
| greptime_private   |
| information_schema |
| public             |
+--------------------+
3 rows in set (0.13 sec)


mysql> use public;
Database changed

mysql> show tables;  # 數(shù)據(jù)太多,省略了些
+-------------------------------------------------------------------------------------+
| Tables                                                                              |
+-------------------------------------------------------------------------------------+
| :node_memory_MemAvailable_bytes:sum                                                 |
| ALERTS                                                                              |
| ALERTS_FOR_STATE                                                                    |
| aggregator_discovery_aggregation_count_total                                        |
| aggregator_unavailable_apiservice                                                   |
| aggregator_unavailable_apiservice_total                                             |
| alertmanager_alerts                                                                 |
| alertmanager_alerts_invalid_total                                                   |
| alertmanager_alerts_received_total                                                  |
| alertmanager_build_info                                                             |
| alertmanager_cluster_alive_messages_total                                           |
| alertmanager_cluster_enabled                                                        |
| alertmanager_cluster_failed_peers                                                   |
| alertmanager_cluster_health_score                                                   |
| alertmanager_cluster_members                                                        |
| alertmanager_cluster_messages_pruned_total                                          |
| alertmanager_cluster_messages_queued                                                |
| alertmanager_cluster_messages_received_size_total                                   |
| alertmanager_cluster_messages_received_total                                        |
| alertmanager_cluster_messages_sent_size_total                                       |
| alertmanager_cluster_messages_sent_total                                            |
| alertmanager_cluster_peer_info                                                      |
| alertmanager_cluster_peers_joined_total                                             |
| alertmanager_cluster_peers_left_total                                               |
| alertmanager_cluster_peers_update_total                                             |
| alertmanager_cluster_pings_seconds_bucket                                           |
| alertmanager_cluster_pings_seconds_count                                            |
| alertmanager_cluster_pings_seconds_sum                                              |
| alertmanager_cluster_reconnections_failed_total                                     |
| alertmanager_cluster_reconnections_total                                            |
| alertmanager_cluster_refresh_join_failed_total                                      |
| alertmanager_cluster_refresh_join_total                                             |
| alertmanager_config_hash                                                            |
| alertmanager_config_last_reload_success_timestamp_seconds                           |
數(shù)據(jù)寫入成功 !
使用 Grafana 渲染數(shù)據(jù)
我們可以直接跳過 Remote Read 直接對接 GreptimeDB,將其作為 Prometheus Datasource,設(shè)置對應(yīng)的 URL 為:http://greptimedb.kubernetes.click/v1/prometheus/
我們這里配置我們的 YAML 文件,配置兩個數(shù)據(jù)源,我們可以做個對比。
apiVersion: v1
kind: Secret
metadata:
  labels:
    app.kubernetes.io/component: grafana
    app.kubernetes.io/name: grafana
    app.kubernetes.io/part-of: kube-prometheus
    app.kubernetes.io/version: 11.4.0
  name: grafana-datasources
  namespace: monitoring
stringData:
  datasources.yaml: |-
    {
        "apiVersion": 1,
        "datasources": [
            {
                "access": "proxy",
                "editable": false,
                "name": "prometheus",
                "orgId": 1,
                "type": "prometheus",
                "url": "http://prom-kubernetes.click",
                "version": 1
            },
            {
                "access": "proxy",
                "editable": false,
                "name": "greptimedb",
                "orgId": 1,
                "type": "prometheus",
                "url": "http://greptimedb.kubernetes.click/v1/prometheus",
                "version": 1
            }
        ]
    }
type: Opaque
驗證 Grafana
只有一小部分的 Dashboard 有數(shù)據(jù),大部分都沒有,真的很納悶
沒有數(shù)據(jù)的
 圖片
圖片
有數(shù)據(jù)的

可以看到我們報錯了,我這里使用 Prometheus 作為數(shù)據(jù)源沒有問題,但是使用 GreptimeDB 就有點問題,但是我們確實有數(shù)據(jù)

我們大家可以思考下,這個問題我覺得涉及的范圍還是挺大的,我感覺是權(quán)限的問題 RBAC 之類的,或者是 Prometheus 寫入的問題,或者是 Prometheus-agent 搜集的問題
可能原因
數(shù)據(jù)源不匹配
當(dāng)前的 Grafana Dashboard 是基于某些特定的數(shù)據(jù)源和字段(例如 cluster 字段)設(shè)計的。
但是,數(shù)據(jù)源(比如 Prometheus 或 GreptimeDB)中可能沒有這些字段。
不完整的數(shù)據(jù)
如果 Prometheus 或 GreptimeDB 中沒有完整的數(shù)據(jù)(比如缺少某些 Kubernetes 相關(guān)的指標),查詢這些字段會導(dǎo)致錯誤。
比如,你的數(shù)據(jù)源中沒有 kube_namespace_status_phase, kube_pod_info, 等字段。
GreptimeDB 的數(shù)據(jù)不兼容
如果通過 Prometheus Remote Write 將數(shù)據(jù)寫入 GreptimeDB,但沒有正確配置查詢映射,GreptimeDB 中的數(shù)據(jù)結(jié)構(gòu)可能與 Dashboard 的預(yù)期不匹配。
Dashboard 配置問題
使用的 Dashboard 是針對不同環(huán)境(或數(shù)據(jù)源)的。比如,這個 Dashboard 可能是為標準的 Prometheus 配置的,而不是你的特定場景。
字段不匹配
GreptimeDB 和 Prometheus 原始格式存在差異。當(dāng)前的 Grafana Dashboard 很可能是為 Prometheus 數(shù)據(jù)源設(shè)計的,查詢語句中引用了 cluster 等字段,而這些字段可能在 GreptimeDB 中不存在或沒有被正確映射。
Prometheus Remote Write 不完整
如果 Prometheus 的 Remote Write 配置不正確,寫入到 GreptimeDB 的數(shù)據(jù)可能不包含全部指標。例如,某些 Kubernetes 相關(guān)的指標可能被過濾掉了。
GreptimeDB 數(shù)據(jù)格式的差異
GreptimeDB 存儲時可能對 Prometheus 的數(shù)據(jù)結(jié)構(gòu)進行了優(yōu)化或調(diào)整,導(dǎo)致字段名、格式等與 Dashboard 的查詢不匹配。
GreptimeDB 的查詢兼容性
GreptimeDB 是否完全兼容 PromQL(Prometheus Query Language)也需要驗證。如果不完全兼容,則某些 Grafana 查詢可能無法執(zhí)行。
引用鏈接
[1] 官方文檔:https://prometheus.io/blog/2021/11/16/agent/
[2]vmagent:https://github.com/VictoriaMetrics/VictoriaMetrics/blob/master/docs/vmagent.md
[3]vector:https://vector.dev/docs/reference/configuration/sources/prometheus_scrape/#how-it-works
[4]性能報告:https://victoriametrics.com/blog/comparing-agents-for-scraping/
[5]維護模式:https://github.com/grafana/agent
[6]Alloy:https://github.com/grafana/alloy
[7]GreptimeDB:https://github.com/GrepTimeTeam/greptimedb
[8]Prometheus Remote Write:https://docs.greptime.com/user-guide/write-data/prometheus
[9]部署 greptimedb-operator:https://github.com/GreptimeTeam/helm-charts/tree/main/charts/greptimedb-operator
[10]greptimedb-operator:https://github.com/GreptimeTeam/greptimedb-operator
[11]單機版:https://docs.greptime.com/zh/getting-started/installation/greptimedb-standalone[
12]分布式集群:https://docs.greptime.com/zh/getting-started/installation/greptimedb-cluster
[13]SQL 查詢:https://docs.greptime.com/zh/user-guide/query-data/sql
[14]PromQL 查詢:https://docs.greptime.com/zh/user-guide/query-data/promql
[15]OrbStack:https://orbstack.dev/
[16]Github:https://github.com/prometheus-operator/prometheus-operator[17]MySQL Community Downloads: https://dev.mysql.com/downloads/