IOS開發框架:Core Plot開源框架使用
IOS開發框架Core Plot開源框架使用是本文要介紹的內容,主要是來學習IOS開發中框架的學習。iPhone下的圖形框架并不是很多。其中比較知名的就兩個s7graphview和Core Plot。巧的是兩個都是Google的。前者使用簡單,但功能單一,只能畫曲線圖。后者是開源項目,項目仍在不斷更新中,用起來可就復雜多了,而且各個版本會有差異,包括屬性、方法,甚至是類名都有改變。
關于Core Plot使用的中文網上資料,不是缺乏,而是根本沒有。唯一的一篇介紹得比較詳細的文章是“Using Core Plot in an iPhone Application”, 原文是英文的:http://www.switchonthecode.com/tutorials/using-core-plot-in-an-iphone-application 。但時間真的是太老了,居然是09年5月發表的,原文很多地方已經不再適用。因此我費了好大的勁,才把原文中的代碼跑通了,不敢獨享,與各位共享之。
一、下載安裝Core Plot框架
原文介紹的是“源代碼”版本。首先下載并安裝Mercurial(很簡單,在http://www.selenic.com/mercurial/wiki/ 有標準Mac安裝包下載),再使用命令:
- hg clone http://core-plot.googlecode.com/hg/ core-plot
即可把Core Plot項目源代碼下載到指定目錄core-plot下。
截至本文發表時止,Core Plot已經提供了Mac標準安裝器 CorePlotInstaller_0.2.2.zip , 你可以直接用安裝器安裝,可以很方便地把Core Plot直接以SDK的方式安裝到本機。SDK的使用方法見后一篇博文《Core Plot SDK的用法》。
二、如何在項目中使用Core Plot
由于iOS 的限制,Core Plot以靜態庫的形式鏈接到iPhone應用。在core-plot/framework目錄下存在CorePlot- CocoaTouch.xcodeproj文件,這就是一個靜態庫項目。關于靜態庫的使用,前一篇博文《封裝自己的控件庫:iPhone靜態庫的應用》已 經有介紹,使用方法都是一樣的。
1、新建Windows-base Application項目。
2、使用Add->Existing Files…,把CorePlot-CocoaTouch.xcodeproj添加到新項目中。
3、把libCorePlot-CocoaTouch.a最右邊的“add to target”小框勾上。
4、選擇Target “info->General”,添加對項目CorePlot-CocoaTouch的依賴(引用)。
5、選擇新項目的“info->Build”,在“Header Search Paths”中添加Core Plot頭文件搜索路徑,如: /Users/kmyhy/core-plot/framework。注意要選中“Recursive”小勾(英文原文中沒有提這一點)。同時,在Other Linker Flags中要增加兩個選項:-ObjC和-all_load(英文原文中遺漏了第2個選項)。
6、新建一個ViewController,如TestViewController。在本例中,我們勾選了“With Xib”選項。在英文原文中,要求在Interface Build中把xib的View對象由UIView改為CPLayerHostingView(其實應當是CPGraphHostingView)。但在這里,其實沒有必要,只需在源代碼中修改就可以了。
7、.h文件:
- #import <UIKit/UIKit.h>
- #import "CorePlot-CocoaTouch.h"
- @interface TestViewController : UIViewController <CPPlotDataSource>{
- CPXYGraph * graph ;
- }
- @end
8、.m文件:
- #import "TestViewController.h"
- @implementation TestViewController
- -( NSUInteger )numberOfRecordsForPlot:( CPPlot *)plot {
- return 51 ;
- }
- -( NSNumber *)numberForPlot:( CPPlot *)plot field:( NSUInteger )fieldEnum recordIndex:( NSUInteger )index {
- double val = (index/ 5.0 )- 5 ;
- if (fieldEnum == CPScatterPlotFieldX )
- { return [ NSNumber numberWithDouble :val]; }
- else
- {
- if (plot. identifier == @"X Squared Plot" )
- { return [ NSNumber numberWithDouble :val*val]; }
- else
- { return [ NSNumber numberWithDouble : 1 /val]; }
- }
- }
- - ( void )viewDidLoad {
- //[super viewDidLoad];
- graph = [[ CPXYGraph alloc ] initWithFrame : self . view . bounds ];
- // 原來的 CPLayerHostingView 由 CPGraphHostingView 所代替
- self . view = [[ CPGraphHostingView alloc ] initWithFrame :[ UIScreen mainScreen ]. bounds ];
- CPGraphHostingView *hostingView = ( CPGraphHostingView *) self . view ;
- hostingView. hostedGraph = graph ;
- graph . paddingLeft = 20.0 ;
- graph . paddingTop = 20.0 ;
- graph . paddingRight = 20.0 ;
- graph . paddingBottom = 20.0 ;
- CPXYPlotSpace *plotSpace = ( CPXYPlotSpace *) graph . defaultPlotSpace ;
- plotSpace. xRange = [ CPPlotRange plotRangeWithLocation : CPDecimalFromFloat (- 6 )
- length : CPDecimalFromFloat ( 12 )];
- plotSpace. yRange = [ CPPlotRange plotRangeWithLocation : CPDecimalFromFloat (- 5 )
- length : CPDecimalFromFloat ( 30 )];
- CPLineStyle *lineStyle = [ CPLineStyle lineStyle ];
- //CPLineStyle 的 lineColor 和 lineWidth 已經變為只讀屬性
- // lineStyle.lineColor = [CPColor blackColor];
- // lineStyle.lineWidth = 2.0f;
- CPXYAxisSet *axisSet = ( CPXYAxisSet *) graph . axisSet ;
- //majorIntervalLength 的類型由 NSDecimalNumber 改變為 NSDecimal
- axisSet. xAxis . majorIntervalLength = [[ NSDecimalNumber decimalNumberWithString : @"5" ] decimalValue ];
- axisSet. xAxis . minorTicksPerInterval = 4 ;
- axisSet. xAxis . majorTickLineStyle = lineStyle;
- axisSet. xAxis . minorTickLineStyle = lineStyle;
- axisSet. xAxis . axisLineStyle = lineStyle;
- axisSet. xAxis . minorTickLength = 5.0f ;
- axisSet. xAxis . majorTickLength = 7.0f ;
- //axisLableOffset 屬性由 labelOffset 所代替
- axisSet. xAxis . labelOffset = 3.0f ;
- // axisSet.xAxis.axisLabelOffset = 3.0f;
- axisSet. yAxis . majorIntervalLength = [[ NSDecimalNumber decimalNumberWithString : @"5" ] decimalValue ];
- axisSet. yAxis . minorTicksPerInterval = 4 ;
- axisSet. yAxis . majorTickLineStyle = lineStyle;
- axisSet. yAxis . minorTickLineStyle = lineStyle;
- axisSet. yAxis . axisLineStyle = lineStyle;
- axisSet. yAxis . minorTickLength = 5.0f ;
- axisSet. yAxis . majorTickLength = 7.0f ;
- //axisLableOffset 屬性由 labelOffset 所代替
- axisSet. yAxis . labelOffset = 3.0f ;
- // axisSet.yAxis.axisLabelOffset = 3.0f;
- //CPPlotSpace 的 bounds 屬性不再有效
- CPScatterPlot *xSquaredPlot = [[[ CPScatterPlot alloc ]
- initWithFrame : self . view . bounds ] autorelease ];
- //initWithFrame:graph.defaultPlotSpace.bounds] autorelease];
- xSquaredPlot. identifier = @"X Squared Plot" ;
- //CPLineStyle 的 lineColor 和 lineWidth 已經變為只讀屬性
- // xSquaredPlot.dataLineStyle.lineWidth = 1.0f;
- // xSquaredPlot.dataLineStyle.lineColor = [CPColor redColor];
- xSquaredPlot. dataSource = self ;
- [ graph addPlot :xSquaredPlot];
- CPPlotSymbol *greenCirclePlotSymbol = [ CPPlotSymbol ellipsePlotSymbol ];
- greenCirclePlotSymbol. fill = [ CPFill fillWithColor :[ CPColor greenColor ]];
- greenCirclePlotSymbol. size = CGSizeMake ( 2.0 , 2.0 );
- xSquaredPlot. plotSymbol = greenCirclePlotSymbol;
- //CPPlotSpace 的 bounds 屬性不再有效
- CPScatterPlot *xInversePlot = [[[ CPScatterPlot alloc ]
- initWithFrame : self . view . bounds ] autorelease ];
- //initWithFrame:graph.defaultPlotSpace.bounds] autorelease];
- xInversePlot. identifier = @"X Inverse Plot" ;
- //CPLineStyle 的 lineColor 和 lineWidth 已經變為只讀屬性
- // xInversePlot.dataLineStyle.lineWidth = 1.0f;
- // xInversePlot.dataLineStyle.lineColor = [CPColor blueColor];
- xInversePlot. dataSource = self ;
- [ graph addPlot :xInversePlot];
- }
- - ( void )dealloc {
- [ super dealloc ];
- }
- @end
仔細查看代碼,你會發現原文中的代碼被我做了一些修改和調整。
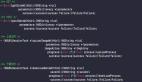
附一張Core Plot框架的類層次圖,便于理解代碼中各個對象的使用:
注意,右邊各個類的顏色和左邊各個層次的顏色是對應的,如圖所示:

小結:IOS開發框架:Core Plot開源框架使用的內容介紹完了,希望通過本文的學習能對你有所幫助!