關于Python可視化Dash工具—散點地圖、熱力地圖、線形地圖
作者:一只小小鳥鳥
好不容易實現了choropleth_mapbox地圖,也順道把散點地圖、熱力地圖、線形地圖處理掉吧,做到有始有終,再邁向新的領域.
好不容易實現了choropleth_mapbox地圖,也順道把散點地圖、熱力地圖、線形地圖處理掉吧,做到有始有終,再邁向新的領域;從微信公眾號里拿到了按分省統計的用戶數據,又拿到了各地市數據,通過這兩種數據分別實現choropleth_mapbox、scatter_mapbox、density_mapbox,至于line_mapbox構造數據過于麻煩,直接拷貝了官網上的案例。
基于分省統計的用戶數據,通過choropleth_mapbox進行行政區域的數據展示。
import json
import pandas as pd
import plotly.express as px
# 中國地圖
with open('china_geo.json') as response:
counties = json.load(response)

df = pd.read_csv("gongzhonghaopro.csv",encoding="utf-8",
dtype={"areacode": str})

fig = px.choropleth_mapbox(df, geojson=counties, featureidkey="properties.adcode",locations='areacode',  color='total',
#color_continuous_scale="Viridis",
range_color=(0, 320),
color_continuous_scale='Reds',
zoom=3, center={"lat": 37.4189, "lon": 116.4219},
mapbox_style='carto-positron')

fig.update_layout(margin={"r": 0, "t": 0, "l": 0, "b": 0})
fig.show()
??
基于分地市統計的用戶數據,通過scatter_mapbox進行各城市的數據展示。這里面不同的地方是直接采用mapbox的地圖,而且申請了一個tokenkey,此外數據的構成方面,需要附上各區域的經度、維度、展示數據等信息。
all_data = pd.read_csv("gongzhonghao.csv",encoding="utf-8")
token = 'pk.eyJ1Ijoiam9obndhbmcyMDIxIiwiYSI6ImNrbWNheTJ1NzA4cWQyb21uZHYycTgzMGQifQ.Tyk26CpuPLPi3bpw05yM_A'
fig = px.scatter_mapbox(all_data, lat="langitude", lon="latitude", hover_name="city", hover_data=["city", "total"],
color="total",
size="total",
#color_continuous_scale=px.colors.sequential.matter,
size_max=30,
color_continuous_scale="Reds",
zoom=5, height=1000)

fig.update_layout(mapbox = {'accesstoken': token, #需要到官網注冊一個token
'center': {'lon': 106.573, 'lat': 30.66342},  #指定的地圖中心
'zoom': 3,
'style': 'basic', #顯示的地圖類型,有遙感地圖,街道地圖等類型
},
margin = {'l': 0, 'r': 0, 't': 0, 'b': 0})
fig.show()
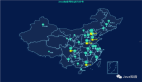
基于分地市統計的用戶數據,通過density_mapbox進行各城市的數據展示。熱力圖相對來說呈現效果要好于scatter_mapbox,不過這里面關于range_color的設置一直沒想明白該如何正確處理。
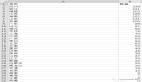
all_data = pd.read_csv("gongzhonghao.csv",encoding="utf-8")
print(all_data)
fig = px.density_mapbox(all_data, lat='langitude', lon='latitude', z='total', radius=20,
color_continuous_scale=px.colors.diverging.RdYlGn[::-1],
center={"lat": 37.4189, "lon": 116.4219}, zoom=3,
range_color =(0,15),
mapbox_style="stamen-terrain")
fig.show()
??
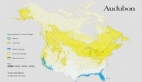
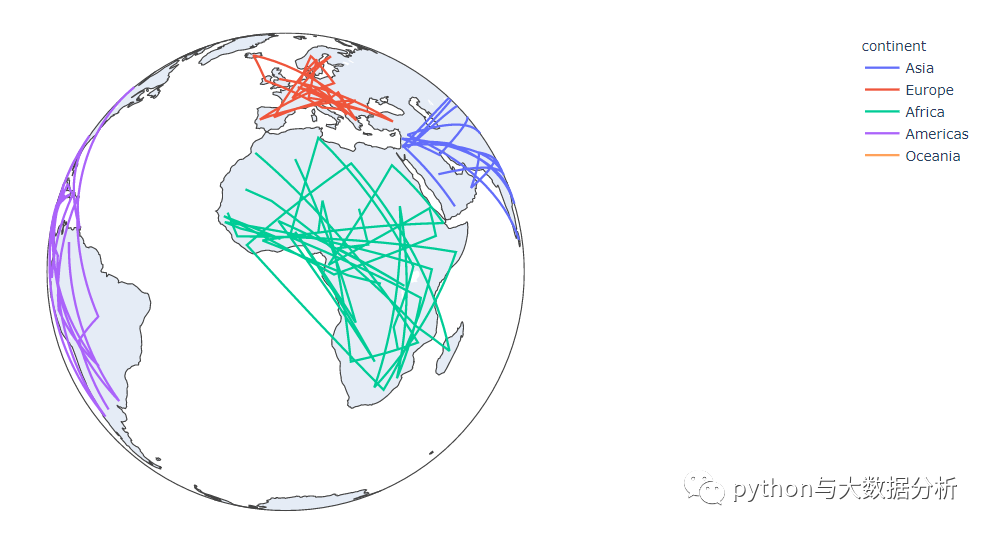
基于官方案例的line_geo地圖展示。
? ?
?
下一步該探索一下dash_core_components 、dash_html_components 、idash_bootstrap_components組件了,最終的目標是實現可視化大屏,還有很長的路要走。
責任編輯:武曉燕
來源:
python與大數據分析