Spring Boot服務監控(Prometheus)

哲學
最近看到了一句話:定乎內外之分 辯乎榮辱之境。
一個外國作家也說過:
我生命里的的最大突破之一,就是我不再為別人的看法而擔憂。此后,我真的能自由的去做我認為對自己最好的事,只有在我們不需要外來的贊許時,才變得自由。
說的都很好。人就是要突破自己,就像許三多,不要在意別人的看法,做自己認為有意義的事,今天比昨天好,這不就是希望。
監控
思考完一波哲學,開始搞搞軟件上的東西。這篇記錄下監控配置相關的知識。
為什么需要監控系統:簡單點說。隨時掌握系統運行情況,保證在你預期內運行。
先不扯別的,看兩張效果圖:
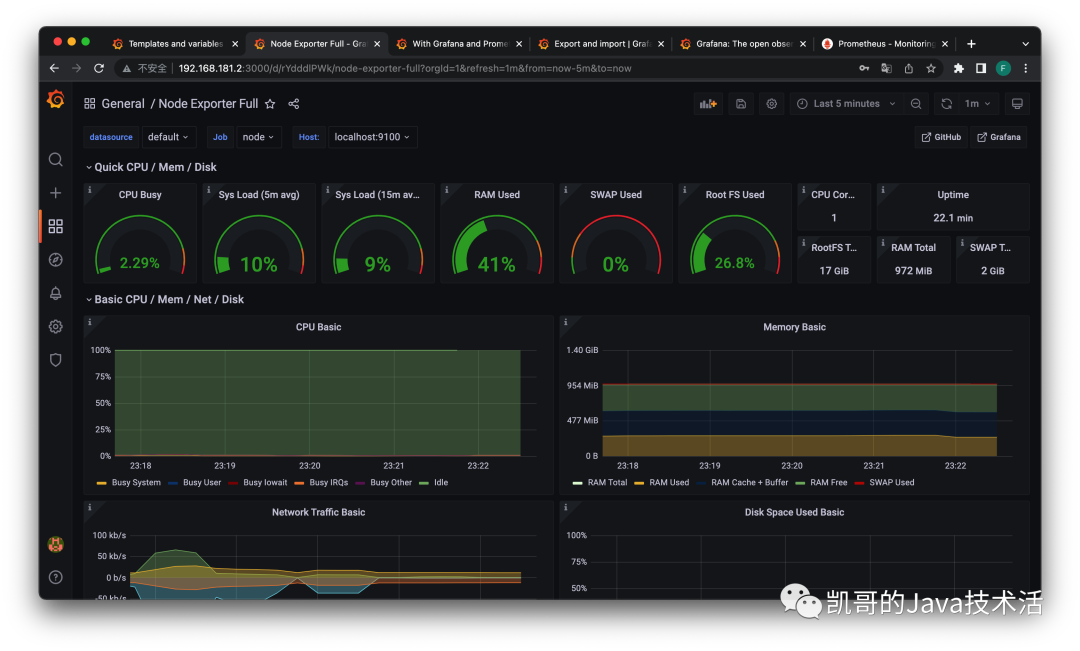
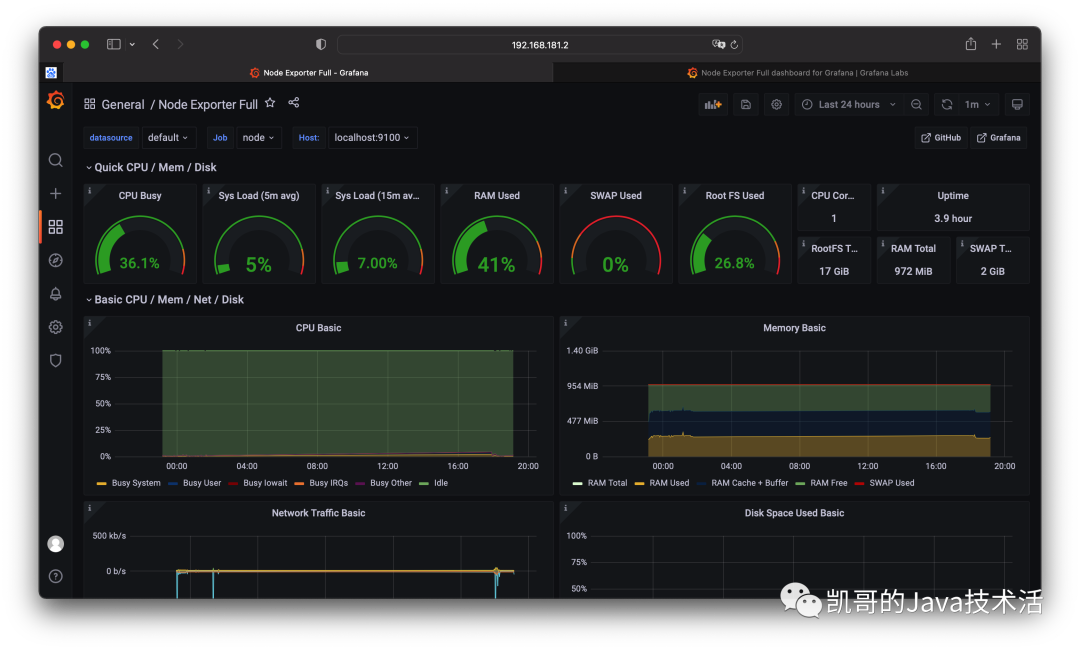
1、監控Linux服務器的CPU,內存,磁盤等:
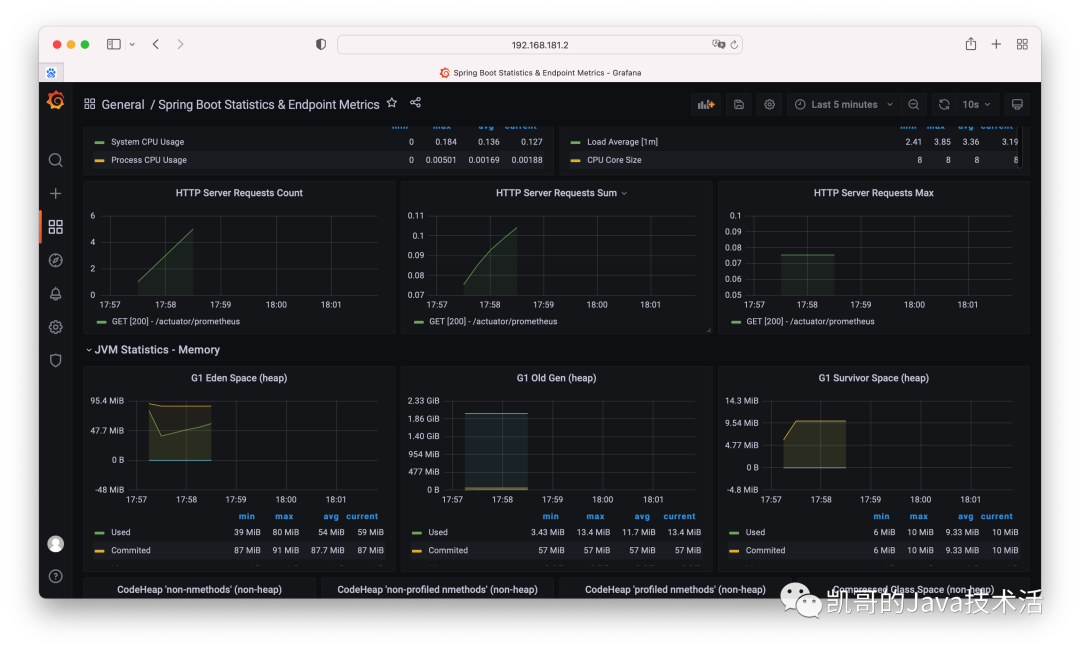
2、監控Tomcat和jvm:
概念
1、Prometheus是什么,一款開源的優秀的時間序列數據庫監控軟件。收集各項指標,用于監控系統狀態。提供強大的PromQL查詢語句,滿足各種個性化查詢需求。
2、什么是Metrics,Metrics就是監控指標,在外行術語中,指標是數字度量,時間序列意味著隨著時間的推移記錄變化。用戶想要測量的內容因應用程序而異。對于web服務器來說,它可能是請求時間,對于數據庫,它可能是活動連接數或活動查詢數等。簡單理解,就是你想監控的東西,不必過分深究。
3、Grafana又是什么?簡單來說就是圖形化展示工具,和Prometheus天作之合。
安裝配置
1、下載prometheus:
wget https://github.com/prometheus/prometheus/releases/download/v2.35.0/prometheus-2.35.0.linux-amd64.tar.gz
tar xvfz prometheus-*.tar.gz
cd prometheus-*
2、配置prometheus:
global:
scrape_interval:     15s # By default, scrape targets every 15 seconds.
  # Attach these labels to any time series or alerts when communicating with
  # external systems (federation, remote storage, Alertmanager).
external_labels:
monitor: 'codelab-monitor'
# A scrape configuration containing exactly one endpoint to scrape:
# Here it's Prometheus itself.
scrape_configs:
  # The job name is added as a label `job=<job_name>` to any timeseries scraped from this config.
- job_name: 'prometheus'
    # Override the global default and scrape targets from this job every 5 seconds.
scrape_interval: 5s
static_configs:
    # 這里這個就是自帶的監控,監控preometheus自己
      - targets: ['localhost:9090']
以上就完成了prometheus的下載和配置,非常的簡單。
訪問host:9090就可以看到如下界面:
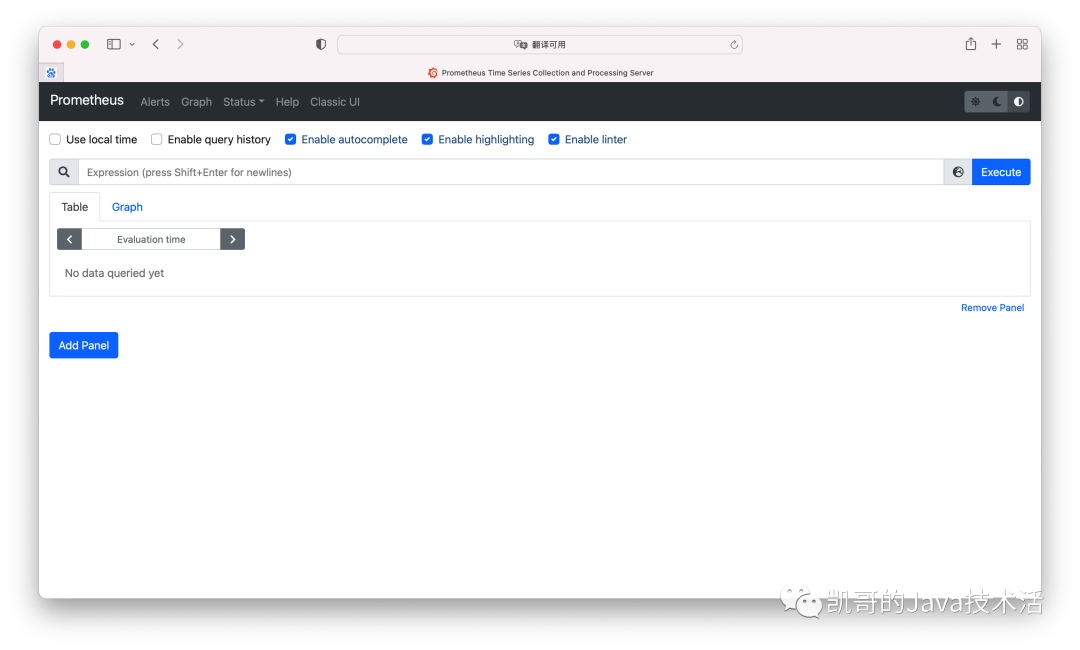
這就是prometheus的管理頁面。不夠酷炫,接下來下載grafana。
3、下載grafana
sudo yum install grafana
sudo systemctl start grafana-server
這就完事了。驗證下,默認的管理端是運行在3000端口,也就是http://ip:3000,就可以打開如下頁面,賬號密碼默認都是admin。
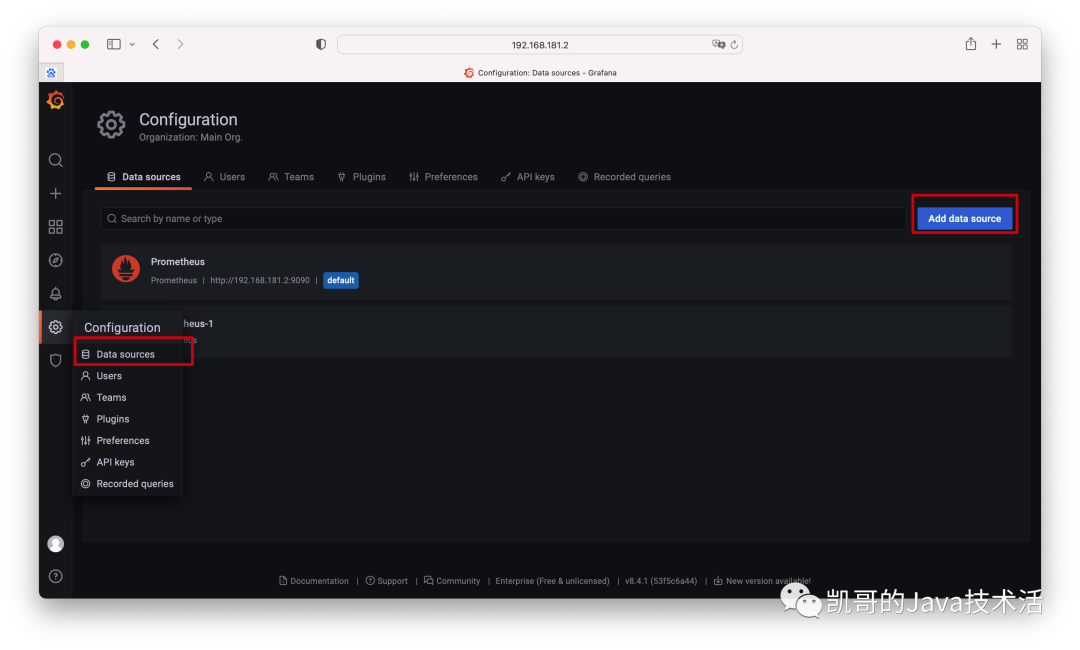
我們現在有了prometheus和grafana,接下來將grafana連上prometheus。
1、添加數據源。
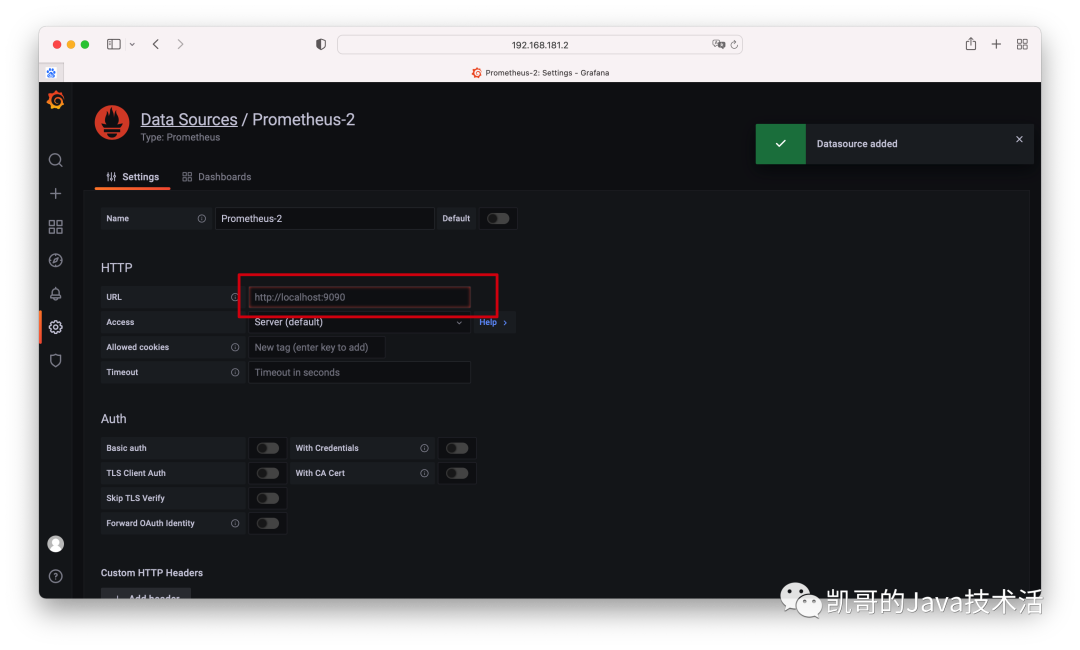
2、連接上prometheus。
3、測試是否連接成功。
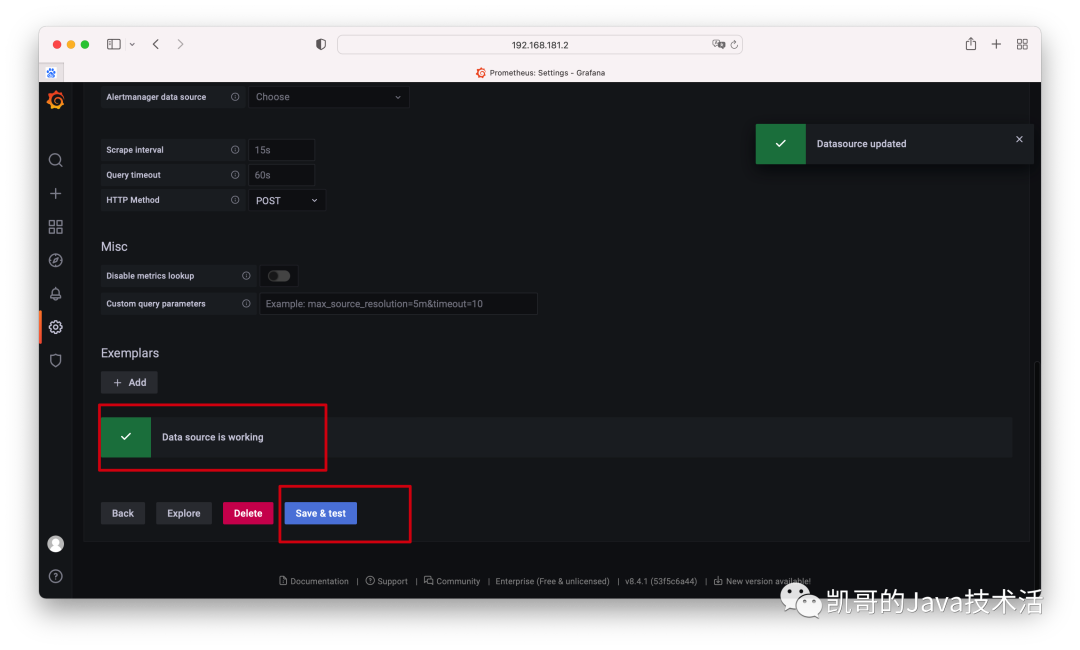
這就完成了。截止到現在,最基本prometheus和grafna下載和安裝的操作就完畢了。
exporter
接下來,來監控linux的狀態。這個也是極其的簡單。
首先下載node_exporter,然后啟動
wget https://github.com/prometheus/node_exporter/releases/download/v*/node_exporter-*.*-amd64.tar.gz
tar xvfz node_exporter-*.*-amd64.tar.gz
cd node_exporter-*.*-amd64
./node_exporter
再去prometheus修改下配置文件prometheus.yaml,仿照之前的,加上下面的配置。然后重啟prometheus。
- job_name: node
  static_configs:
  - targets: ['localhost:9100']
這樣已經有了監控linux運行情況的能力了,只是目前還沒有展示出來而已。
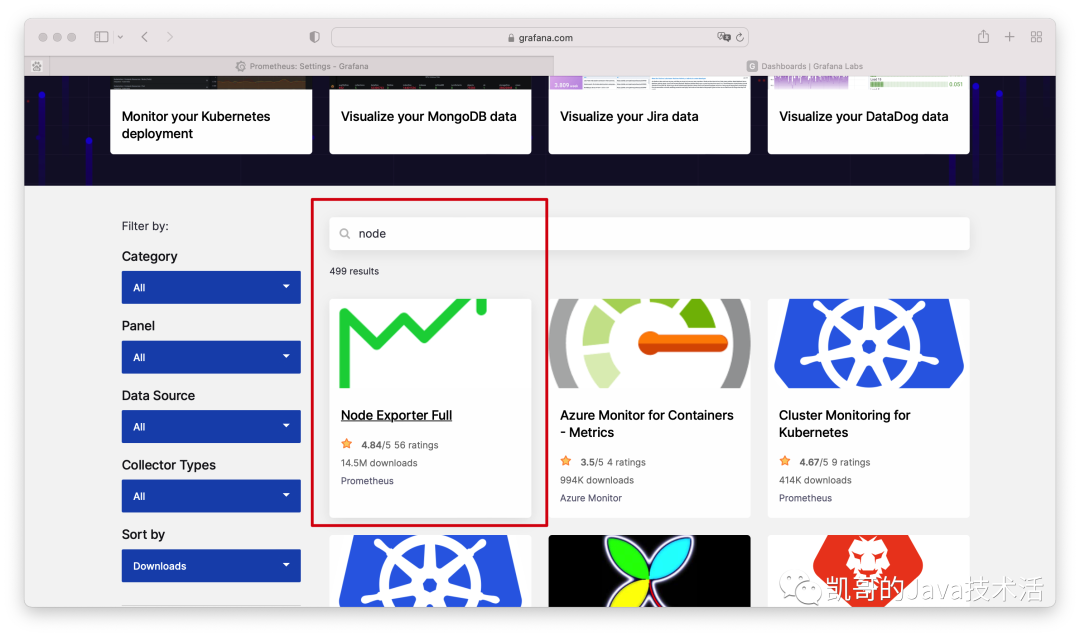
接下來加上酷炫的頁面。官網有配置好的,甚至不用自己配置。地址是:
https://grafana.com/grafana/dashboards/。
打開如下,搜索node,選中第一個。
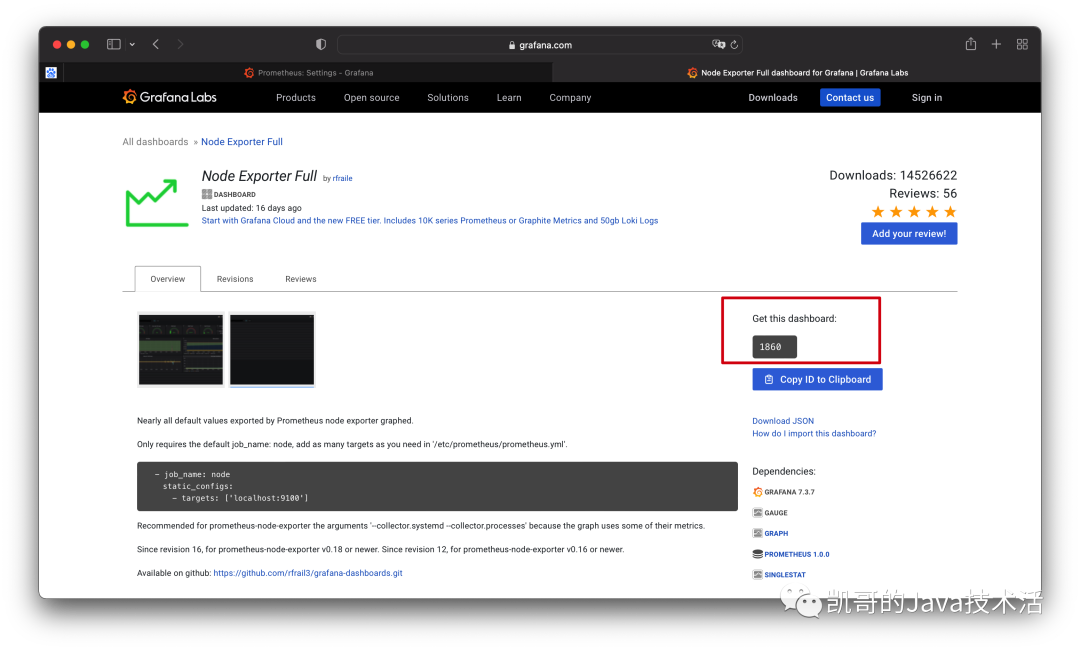
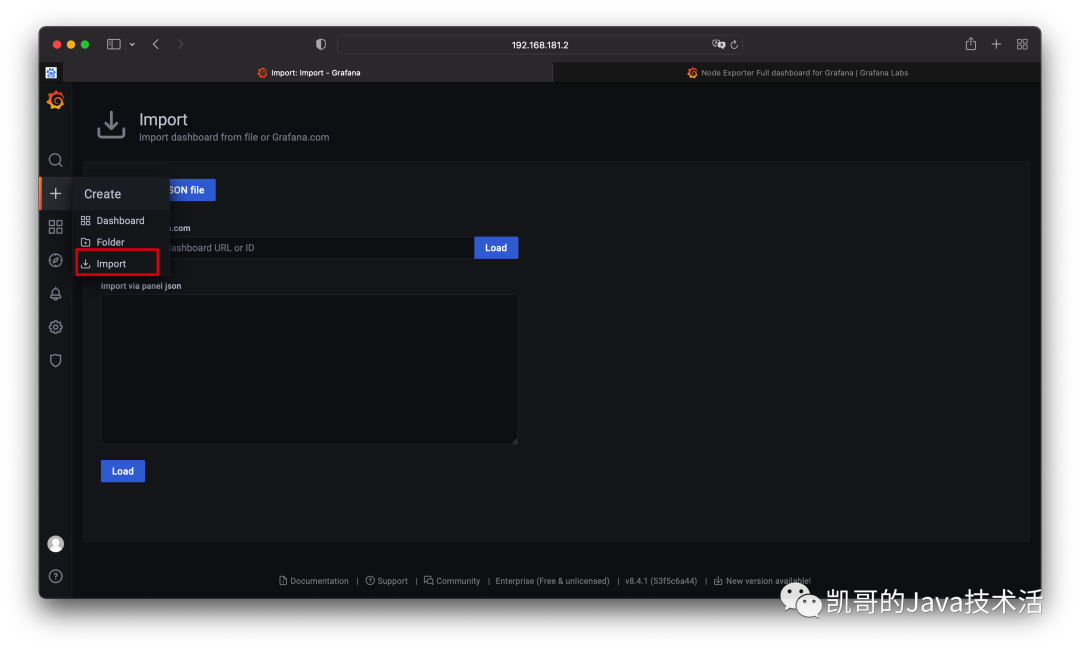
復制官方提供的模板ID。然后去grafana導入一下即可。
大功告成了,如下圖所示。
jvm的也是類似的操作,自己可以試驗。
自定義監控指標
以上都是官方提供的exporter。監控機器或者jvm的,如果我們想監控自己的業務呢?例如想監控當前有多少請求?每個請求的性能如何?或者其他一些自定義的監控項?
在寫代碼之前,認識幾個概念:prometheus中的四種指標類型。Counter(計數器):Counter類型用于增加的值,例如請求計數或錯誤計數。最重要的是,絕對不能將計數器用于可能減小的值。只增不減。
Gauges(儀表板(我自己的翻譯)):儀表類型可用于向下和向上的值,例如當前內存使用量或隊列中的項目數,可增可減。
histogram(直方圖):這個概念比較難以理解。暫時我們認為他就是統計分位樹的就好。例如你這個接口99%請求的耗時,TP99。
summaries:本篇不講,感興趣自行查看官網。
這四種類型,都什么時候使用呢?Counter:
1、你想記錄一個只上升的值。
2、希望以后能夠查詢該值的增長速度(即增長率)。
Guage:
1、想要記錄一個可以上升或下降的值。
2、你不需要查詢它的增長率。
histogram:分桶計算,分位計算,計算TP99等。
OK,接下來寫代碼。
監控Spring Boot應用
用java,一般用Spring Boot項目開發,這個很容易實現,全部都是封裝好的。
從一個最基本的項目入手,只需要如下的依賴即可。注意到這里除了web模塊,還加了兩個監控模塊。
<dependencies>
    <dependency>
      <groupId>org.springframework.boot</groupId>
      <artifactId>spring-boot-starter-actuator</artifactId>
    </dependency>
    <dependency>
      <groupId>io.micrometer</groupId>
      <artifactId>micrometer-registry-prometheus</artifactId>
    </dependency>
    <dependency>
      <groupId>org.springframework.boot</groupId>
      <artifactId>spring-boot-starter-web</artifactId>
    </dependency>
    <dependency>
      <groupId>org.springframework.boot</groupId>
      <artifactId>spring-boot-starter-test</artifactId>
      <scope>test</scope>
    </dependency>
  </dependencies>
然后寫一個簡單的controller。
package com.test.promethusmetrics;
import io.prometheus.client.CollectorRegistry;
import io.prometheus.client.Counter;
import org.springframework.web.bind.annotation.GetMapping;
import org.springframework.web.bind.annotation.RestController;
/**
 * 測試Counter
 *
 * @author fengkai
 */
@RestController
public class CounterController {
private final Counter requestCount;

public CounterController(CollectorRegistry collectorRegistry) {
        requestCount = Counter.build()
                .name("request_count")
                .help("Number of hello requests.")
                .register(collectorRegistry);
    }
@GetMapping(value = "/hello")
public String hello() {
        requestCount.inc();
return "Hi!";
    }
}
注意到這里用了counter。這就完成了counter計數的代碼部分。
代碼完成后,還需要讓prometheus去拉取我們Spring Boot的監控指標,配置和之前很相似。
添加如下配置,然后重啟prometheus。
- job_name: "spring"
    metrics_path: /actuator/prometheus
    static_configs:
      - targets: ["192.168.181.1:8080"]
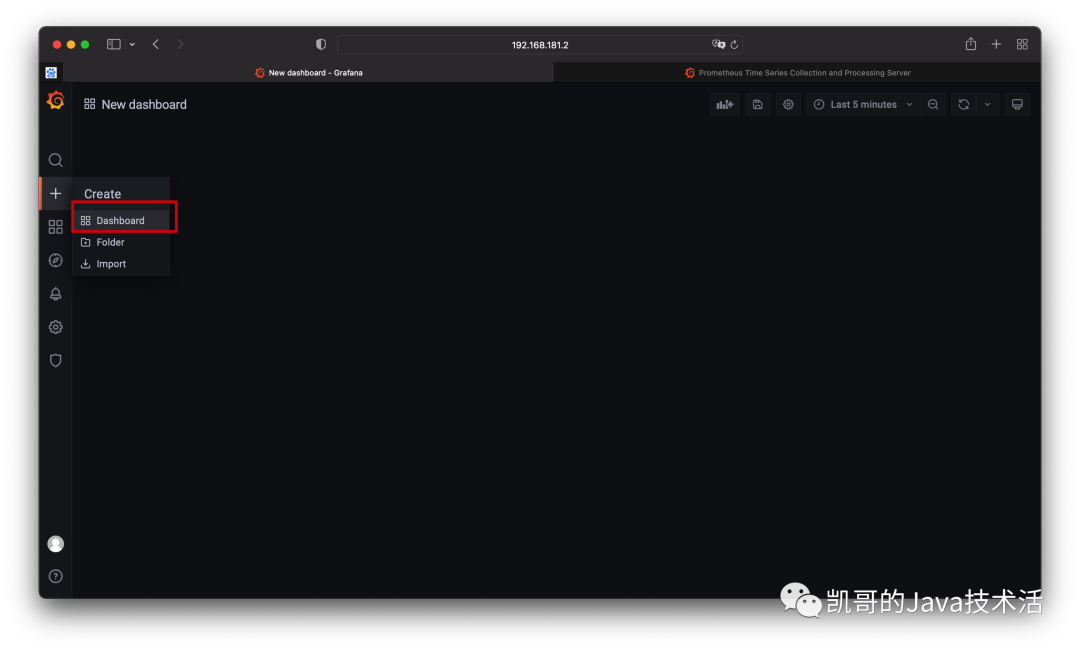
我們在瀏覽器上多請求幾次。然后我們去grafana上配置監控面板,首先添加。
然后配置指標。
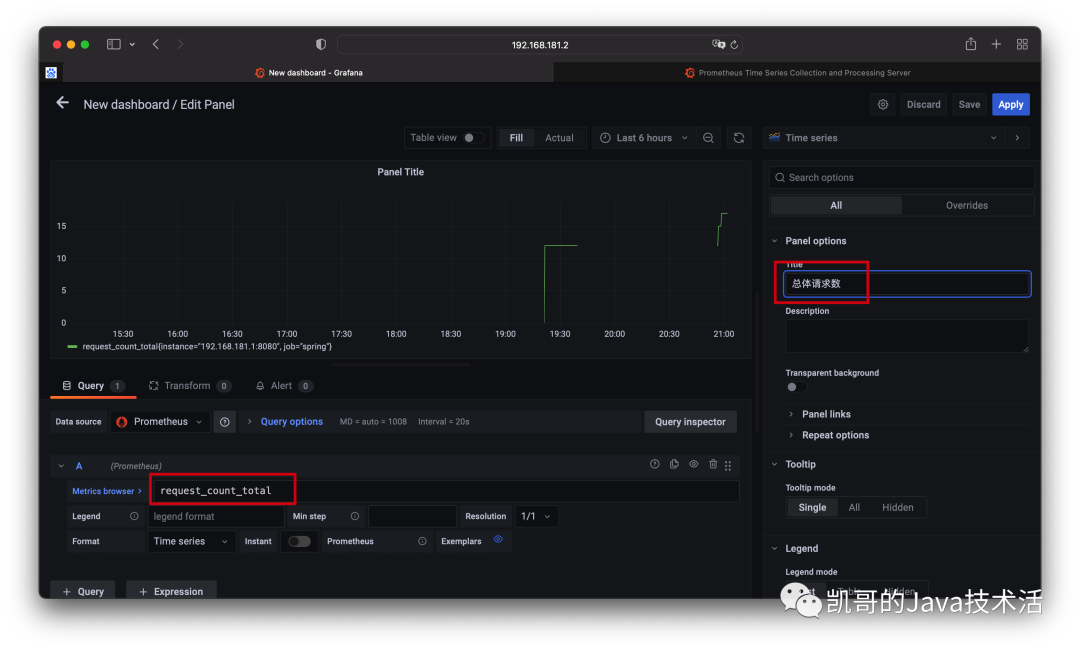
效果圖如下。
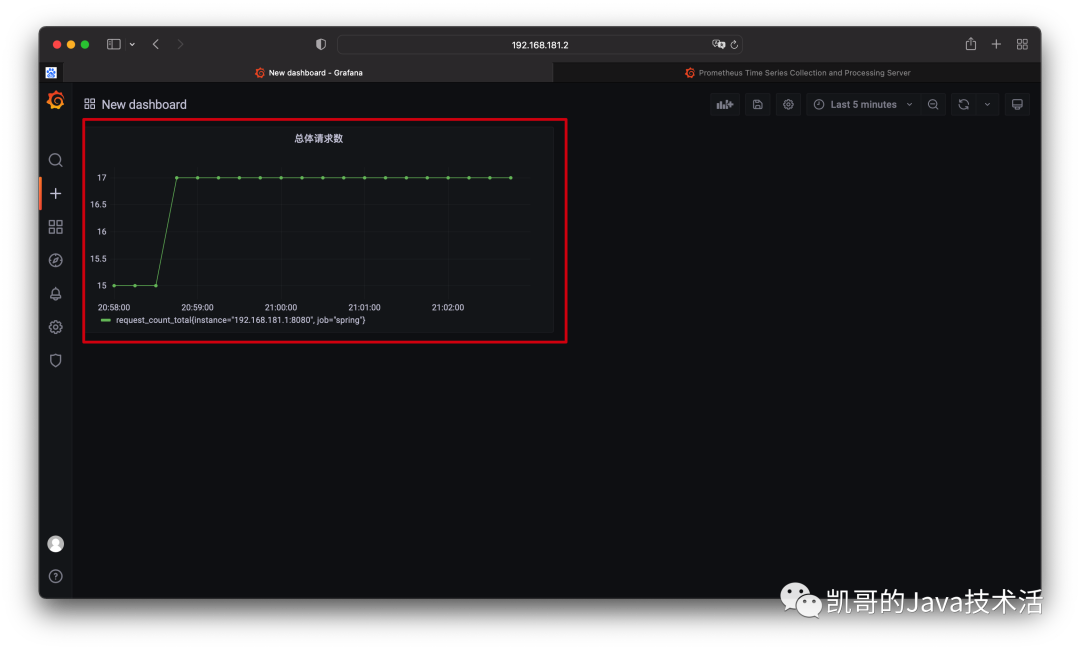
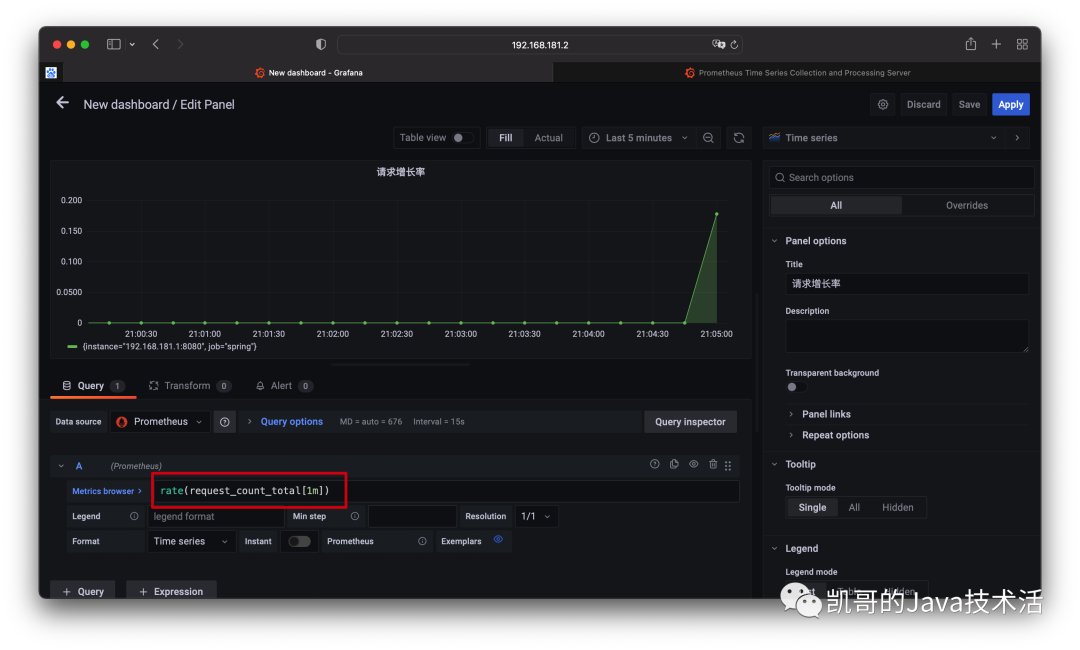
以上只是單純的計數,實際用途不是很大,其實更關心的應該是增長率。這又該如何統計呢?
只需要在外層包裹rate函數就可以了,具體的原理可以后續再解釋,這里先用起來。
接下來再試一下使用histogram,統計下Spring Boot服務的請求的耗時情況如何?
代碼部分:
package com.test.promethusmetrics;
import io.prometheus.client.CollectorRegistry;
import io.prometheus.client.Histogram;
import org.springframework.web.bind.annotation.GetMapping;
import org.springframework.web.bind.annotation.RestController;
import static java.lang.Thread.sleep;
@RestController
public class HistogramController {
private final Histogram requestDuration;
public HistogramController(CollectorRegistry collectorRegistry) {
        requestDuration = Histogram.build()
                .name("test_wait")
                .help("Time for HTTP request.")
                .register(collectorRegistry);
    }
@GetMapping(value = "/wait")
public String makeMeWait() throws InterruptedException {
        Histogram.Timer timer = requestDuration.startTimer();
long sleepDuration = Double.valueOf(Math.floor(Math.random() * 10 * 1000)).longValue();
        sleep(sleepDuration);
        timer.observeDuration();
return String.format("I kept you waiting for %s ms!", sleepDuration);
    }
}
多訪問幾次:localhost:8080/wait然后grafana配置,這里用的是直方圖histogram,計算的性能。QL的語法本篇不講解,可以參考官網。
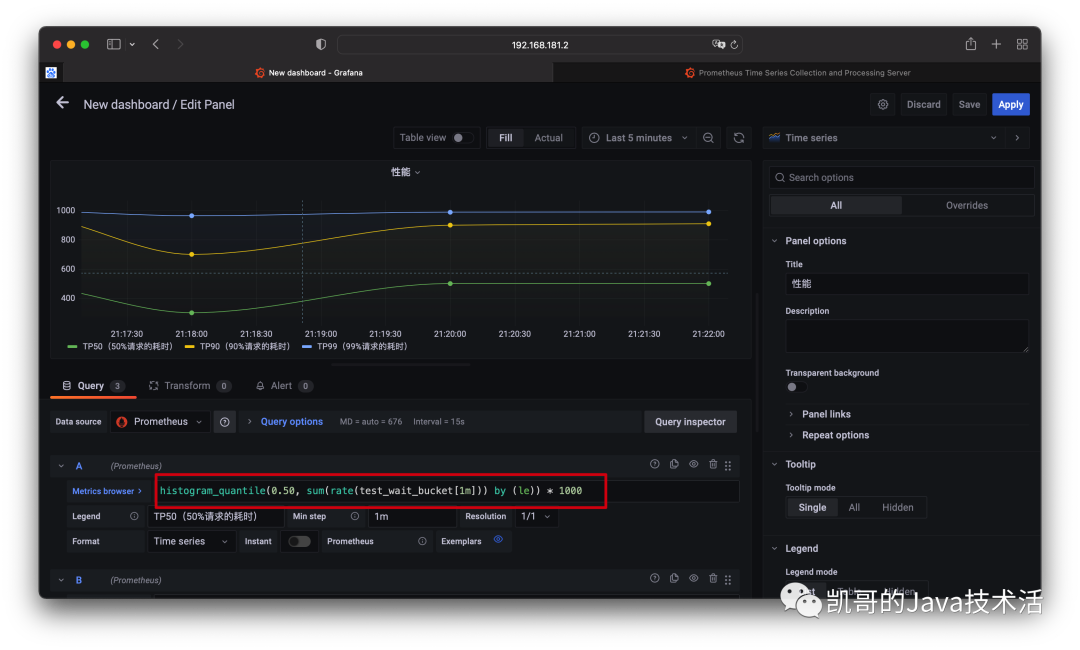
效果圖如下:
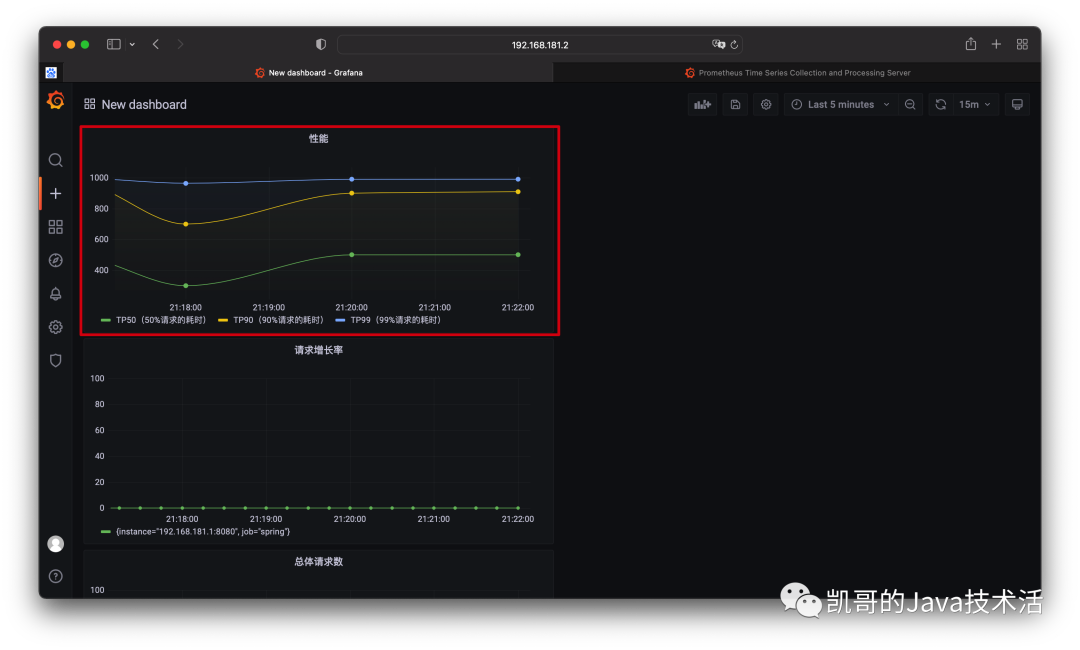
總結
現在,我們應該清楚地了解prometheus中可以使用的不同監控指標類型,以及何時使用它們,如何查詢它們。并且能夠用grafna配置酷炫的監控圖標。有了這些知識,可以更有效地發布應用程序中的監控,并確保它始終按預期運行。