ArkUI eTS健康飲食APP之自定義PieChart組件

前言
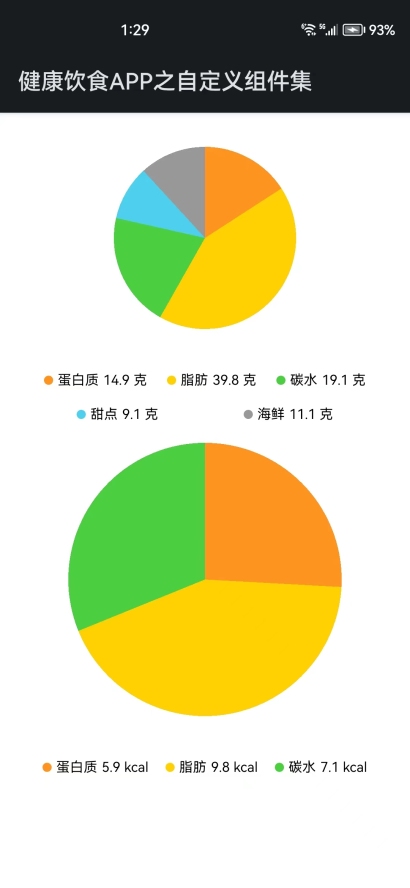
此帖詳細介紹基于畫布組件Canvas上,畫一個餅圖自定義組件,這里先來了解一下Canvas組件的屬性和方法,下面先顯示此帖子Demo的效果:

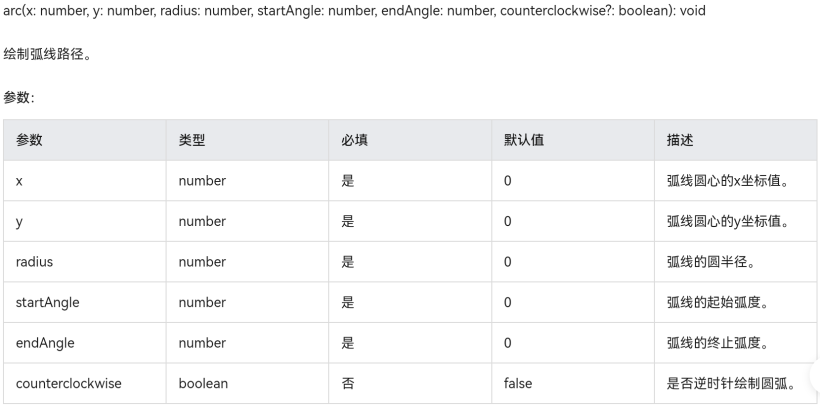
Canvas組件


這里只是此自定義組件用到Canvas畫布組件的關鍵屬性,接口;要查看更多的關于Canvas參數接口,請移步到官方文檔:?https://developer.harmonyos.com/cn/docs/documentation/doc-references/ts-canvasrenderingcontext2d-0000001333720961。
Demo介紹
創建一個新的eTS文件,用來編寫自定義PicChart組件,代碼如下:
@Component
export struct CustomPieChart {
    // 餅圖數據
    private picChartElements: PicChartElement[]
    // 圓半徑
    @State circle_radius:number = 80
    // 單位
    @State unit: string = "克"
    // 獲取上下文
    private settings: RenderingContextSettings = new RenderingContextSettings(true)
    private context: CanvasRenderingContext2D = new CanvasRenderingContext2D(this.settings)

    aboutToAppear() {
        let total = 0
        // 統計總數量
        this.picChartElements.forEach((value) => {
            total += value.quantity
        })

        // 初始化 弧線的終止弧度
        let lastEndAngle = -0.5 * Math.PI
        // 封裝餅圖數據
        this.picChartElements.forEach((value) => {
            // 占用百分比
            let percent = value.quantity / total
            // 四舍五入,獲取整數
            value.percent = Math.round(percent * 100)
            // 初始化終止弧度為 弧線的起始弧度
            value.beginAngle = lastEndAngle
            // 計算弧線的終止弧度
            value.endAngle = (percent * 2 * Math.PI) + lastEndAngle
            // 賦值終止弧度為變量,作為下次的起始弧度
            lastEndAngle = value.endAngle
            // 返回封裝好的對象
            return value
        })
    }

    build() {
        Column({space: 30}) {
            Canvas(this.context)
                // 高度為半徑2倍
                .height(this.circle_radius * 2)
                // 縱橫比,寬度和高度一樣
                .aspectRatio(1)
                // 畫布組件的事件回調,可以在此時進行繪制
                .onReady(() => {
                    this.picChartElements.forEach((item) => {
                        // 創建一個新的控制路徑
                        this.context.beginPath()
                        // 路徑從當前點移動到指定點
                        this.context.moveTo(this.circle_radius, this.circle_radius)
                        // 繪制弧線路徑(弧線圓心的x坐標值,弧線圓心的y坐標值,弧線的圓半徑,弧線的起始弧度,弧線的終止弧度)
                        this.context.arc(this.circle_radius, this.circle_radius, this.circle_radius, item.beginAngle, item.endAngle)
                        // 指定繪制的填充色
                        this.context.fillStyle = item.color
                        // 對封閉路徑進行填充
                        this.context.fill()
                    })
                })
            Flex({direction: FlexDirection.Row, wrap: FlexWrap.Wrap, justifyContent: FlexAlign.SpaceAround}) {
                ForEach(this.picChartElements, (item: PicChartElement) => {
                    Row({ space: 4 }) {
                        // 標注圓點顏色
                        Circle({ width: 8, height: 8 }).fill(item.color)
                        // 標注文本
                        Text(item.element).fontSize(12)
                        // 標注數量
                        Text(item.quantity + ' ' + this.unit).fontSize(12)
                    }
                    .height(30)
                })
            }
            .width('100%')
        }
        .width('100%')
    }
}
export class PicChartElement {
    element: Resource | string  // 顯示文本
    quantity: number            // 數量
    percent: number             // 百分比
    beginAngle: number          // 弧線的起始弧度
    endAngle: number            // 弧線的終止弧度
    color: string               // 顏色
    constructor(element: Resource | string, quantity: number, color: string) {
        this.element = element
        this.quantity = quantity
        this.color = color
    }
}
通過import引用自定義PieChart組件到要使用的頁面,創建Sample頁面,根據PieChart數據實體類定義餅圖數據源,文本,數量,顏色對象,餅圖半徑,顯示單位可選,默認半徑為80,單位為克。具體使用方法看Sample代碼如下:
// 引用自定義組件
import { CustomPieChart, PicChartElement } from '../components/CustomPieChart'
@Entry
@Component
struct SampleCustomPicChart {
  // 餅圖1數據
  private picChartElements: PicChartElement[] = [
    new PicChartElement('蛋白質', 14.9, '#ff9421'),
    new PicChartElement('脂肪', 39.8, '#ffd100'),
    new PicChartElement('碳水', 19.1, '#4cd041'),
    new PicChartElement('甜點', 9.1, '#4cd0ee'),
    new PicChartElement('海鮮', 11.1, '#999999')
  ]
  // 餅圖2數據
  private picChartElements2: PicChartElement[] = [
    new PicChartElement('蛋白質', 5.9, '#ff9421'),
    new PicChartElement('脂肪', 9.8, '#ffd100'),
    new PicChartElement('碳水', 7.1, '#4cd041')
  ]
  build() {
    Column({ space: 10 }) {
      // 餅圖1 (半徑,單位使用默認值)
      CustomPieChart({picChartElements: this.picChartElements})
      // 餅圖2 (半徑指定為120, 單位指定為kcal)
      CustomPieChart({picChartElements: this.picChartElements2, circle_radius: 120, unit: 'kcal'})
    }
    .width('100%')
    .padding(30)
  }
}
總結
通過此帖,可以簡單學會自定義PieChart組件,如何引用使用,在健康飲食APP里,再次完成了一小部分內容,下來繼續一個個組件完成,然后拼裝就出來一個健康飲食APP了。


