最強性能監控工具之Grafana+Prometheus+Exporters
1 監控邏輯
最流行的監控邏輯:

有測試工具、監控工具,才能做性能分析和瓶頸定位。
不管數據啥形式展示,最要緊還是數據來源和含義,以做正確判斷。
2 JMeter+InfluxDB+Grafana數據展示邏輯
JMeter壓測時,使用JMeter控制臺查看結果:

或裝插件看結果:

或JMeter生成HTML:

壓力工具只關心三條曲線:TPS(T由測試目標定義)、響應時間、錯誤率。錯誤率還只是輔助排查問題的曲線,沒問題時,只看TPS、響應時間。
2.1 傳統方案的缺陷
- 1. 整理結果費時
- 2. 在GUI用插件看曲線,高并發時不現實
- 3. 在場景運行時間比較長時,采用生成HTML,會出現消耗內存過大的情況。有很多生成的圖也并不關注
- 4. 生成的結果保存之后再查看比較麻煩,還一個個找
2.2 解決方案
用JMeter的Backend Listener實時發數據到InfluxDB或Graphite。Graphite Backend Listener支持在JMeter 2.13版本,InfluxdDB Backend Listener的支持在JMeter 3.3,都是異步發數據,以便查看。
有這JMeter發給InfluxDB的數據,無需看上面的那些HTML數據,也能直觀看到系統的性能趨勢。以后復看也方便比對。
3 JMeter+InfluxDB+Grafana結構

JMeter發送壓力到服務器的同時,統計TPS、響應時間、線程數、錯誤率等信息。
默認每30s在控制臺輸出一次(jmeter.properties參數#summariser.interval=30可以控制)。
配置Backend Listener后,將統計結果異步發到InfluxDB。最后在Grafana配置:
- ? InfluxDB數據源
- ? JMeter顯示模板
就能實時查看JMeter測試結果,這看到的數據和控制臺數據一樣。
4 數據的傳輸和展示邏輯
4.1 JMeter中Backend Listener配置
就InfluxDB的Backend Listener做個說明。在腳本中加上即可:

先配好influxdb Url、application等信息,application配置可看成是場景名。
4.2 JMeter如何發數據給InfluxDB
關鍵源碼:
private void addMetrics(String transaction, SamplerMetric metric) {
  // FOR ALL STATUS
  addMetric(transaction, metric.getTotal(), metric.getSentBytes(), metric.getReceivedBytes(), TAG_ALL, metric.getAllMean(), metric.getAllMinTime(),
          metric.getAllMaxTime(), allPercentiles.values(), metric::getAllPercentile);
  // FOR OK STATUS
  addMetric(transaction, metric.getSuccesses(), null, null, TAG_OK, metric.getOkMean(), metric.getOkMinTime(),
          metric.getOkMaxTime(), okPercentiles.values(), metric::getOkPercentile);
  // FOR KO STATUS
  addMetric(transaction, metric.getFailures(), null, null, TAG_KO, metric.getKoMean(), metric.getKoMinTime(),
          metric.getKoMaxTime(), koPercentiles.values(), metric::getKoPercentile);


  metric.getErrors().forEach((error, count) -> addErrorMetric(transaction, error.getResponseCode(),
              error.getResponseMessage(), count));
}
站在全局統計視角,這里把JMeter運行的統計結果:
? 如事務的Total請求、發送接收字節、平均值、最大值、最小值等,都加到metric
? 同時也把成功/失敗的事務信息加到metric
更多的添加metric的步驟看JMeter源碼InfluxdbBackendListenerClient.java。
保存metric后,再用InfluxdbMetricsSender發到Influxdb:
@Override
    public void writeAndSendMetrics() {
 ........
        if (!copyMetrics.isEmpty()) {
            try {
                if(httpRequest == null) {
                    httpRequest = createRequest(url);
                }
                StringBuilder sb = new StringBuilder(copyMetrics.size()*35);
                for (MetricTuple metric : copyMetrics) {
                    // Add TimeStamp in nanosecond from epoch ( default in InfluxDB )
                    sb.append(metric.measurement)
                        .append(metric.tag)
                        .append(" ") //$NON-NLS-1$
                        .append(metric.field)
                        .append(" ")
                        .append(metric.timestamp+"000000")
                        .append("\n"); //$NON-NLS-1$
                }


                StringEntity entity = new StringEntity(sb.toString(), StandardCharsets.UTF_8);

                httpRequest.setEntity(entity);
                lastRequest = httpClient.execute(httpRequest, new FutureCallback<HttpResponse>() {
                    @Override
                    public void completed(final HttpResponse response) {
                        int code = response.getStatusLine().getStatusCode();
                        /*
                         * HTTP response summary 2xx: If your write request received
                         * HTTP 204 No Content, it was a success! 4xx: InfluxDB
                         * could not understand the request. 5xx: The system is
                         * overloaded or significantly impaired.
                         */
                        if (MetricUtils.isSuccessCode(code)) {
                            if(log.isDebugEnabled()) {
                                log.debug("Success, number of metrics written: {}", copyMetrics.size());
                            }
                        } else {
                            log.error("Error writing metrics to influxDB Url: {}, responseCode: {}, responseBody: {}", url, code, getBody(response));
                        }
                    }
                    @Override
                    public void failed(final Exception ex) {
                        log.error("failed to send data to influxDB server : {}", ex.getMessage());
                    }
                    @Override
                    public void cancelled() {
                        log.warn("Request to influxDB server was cancelled");
                    }
                });
 ........
            }
        }
    }
通過writeAndSendMetrics,就將所有保存的metrix都發給InfluxDB。
5 InfluxDB存儲結構
InfluxDB如何存儲:
> show databases
name: databases
name
----
_internal
jmeter

> use jmeter
Using database jmeter


> show MEASUREMENTS
name: measurements
name
----
events
jmeter

> select * from events where applicatinotallow='7ddemo'
name: events
time                application text                title
----                ----------- ----                -----
1575255462806000000 7ddemo      Test Cycle1 started ApacheJMeter
1575256463820000000 7ddemo      Test Cycle1 ended   ApacheJMeter
..............

> select * from jmeter where applicatinotallow='7ddemo' limit 10
name: jmeter
time                application avg                count countError endedT hit max maxAT meanAT min minAT pct90.0            pct95.0           pct99.0 rb responseCode responseMessage sb startedT statut transaction
----                ----------- ---                ----- ---------- ------ --- --- ----- ------ --- ----- -------            -------           ------- -- ------------ --------------- -- -------- ------ -----------
1575255462821000000 7ddemo                                          0              0     0          0                                                                                     0               internal
1575255467818000000 7ddemo      232.82352941176472 17    0                 17  849              122       384.9999999999996  849               849     0                               0           all    all
1575255467824000000 7ddemo      232.82352941176472 17                          849              122       384.9999999999996  849               849     0                               0           all    0_openIndexPage
1575255467826000000 7ddemo      232.82352941176472 17                          849              122       384.9999999999996  849               849                                                 ok     0_openIndexPage
1575255467829000000 7ddemo                                          0              1     1          1                                                                                     1               internal
1575255472811000000 7ddemo      205.4418604651163  26    0                 26  849              122       252.6              271.4             849     0                               0           all    all
1575255472812000000 7ddemo                                          0              1     1          1                                                                                     1               internal
1575255472812000000 7ddemo      205.4418604651163  26                          849              122       252.6              271.4             849                                                 ok     0_openIndexPage
1575255472812000000 7ddemo      205.4418604651163  26                          849              122       252.6              271.4             849     0                               0           all    0_openIndexPage
1575255477811000000 7ddemo      198.2142857142857  27    0                 27  849              117       263.79999999999995 292.3500000000001 849     0                               0           all    all
InfluxDB中創建兩個MEASUREMENTS:
? events
? jmeter
這兩個各自存數據,在界面中配置的testtile和eventTags放在events這個MEASUREMENTS中。在模板中這兩個值暫都不用。
在jmeter這個MEASUREMENTS中,可看到application和事務的統計信息,這些值和控制臺一致。
在Grafana中顯示時,就是從這個表中取出數據,根據時序做曲線。
6 Grafana配置
有了JMeter發送到InfluxDB中的數據后,下面得配置Grafana展示。
6.1 配置一個InfluxDB數據源

在這配置URL、Database、User、Password,點擊保存。
6.2 添加一個JMeter dashboard
常用dashboard是Grafana官方ID為5496的模板。導入進來后,選好對應數據源:

就看到界面啦:

這時還沒數據,稍后做個示例,看JMeter的數據怎么對應的該界面數據。
7 數據對比
圖中兩個重要的數據查詢語句。
7.1 TPS曲線
SELECT last("count") / $send_interval
FROM "$measurement_name"
WHERE ("transaction" =~ /^$transaction$/
       AND "statut" = 'ok')
       AND $timeFilter
       GROUP BY time($__interval)
即Total TPS,在這稱為throughput。
這里取的數據來自MEASUREMENTS中成功狀態的所有事務。
7.2 響應時間曲線
SELECT mean("pct95.0")
FROM "$measurement_name"
WHERE ("application" =~ /^$application$/)
AND $timeFilter
GROUP BY "transaction", time($__interval) fill(null)
這是用95 pct內的響應時間畫出的曲線。
7.3 整體展示效果

7.4 JMeter配置場景
10個線程,每個線程迭代10次及兩個HTTP請求:

會產生10x10x2=200次請求。JMeter跑下:

請求數和預想一樣,看Grafana展示結果:

針對每個事務的統計:

7.5 意義
JMeter到Grafana的展示過程完成。以后就:
? 不用再保存JMeter執行結果
? 不用等JMeter輸出HTML
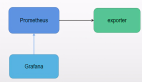
8 node_exporter+Prometheus+Grafana數據展示邏輯
性能測試,在常用的Grafana+Prometheus+Exporter邏輯,第一步就要看os資源。
以node_exporter為例,說明os抽取數據的邏輯,來看監控數據的來源:

node_exporter可支持很多個os:

當然你也能擴展自己的Exporter。
8.1 配置node_exporter
node_exporter目錄:
[root@7dgroup2 node_exporter-0.18.1.linux-amd64]# ll
total 16524
-rw-r--r-- 1 3434 3434    11357 Jun  5 00:50 LICENSE
-rwxr-xr-x 1 3434 3434 16878582 Jun  5 00:41 node_exporter
-rw-r--r-- 1 3434 3434      463 Jun  5 00:50 NOTICE
啟動:
./node_exporter --web.listen-address=:9200 &8.2 配置Prometheus
下載:
wget -c https://github.com/prometheus/prometheus/releases/download/v2.14.0/prometheus-2.14.0.linux-amd64.tar.gz解壓后目錄:
[root@ prometheus-2.11.1.linux-amd64]# ll
total 120288
drwxr-xr-x. 2 3434 3434     4096 Jul 10 23:26 console_libraries
drwxr-xr-x. 2 3434 3434     4096 Jul 10 23:26 consoles
drwxr-xr-x. 3 root root     4096 Nov 30 12:55 data
-rw-r--r--. 1 3434 3434    11357 Jul 10 23:26 LICENSE
-rw-r--r--. 1 root root       35 Aug  7 23:19 node.yml
-rw-r--r--. 1 3434 3434     2770 Jul 10 23:26 NOTICE
-rwxr-xr-x. 1 3434 3434 76328852 Jul 10 21:53 prometheus
-rw-r--r--  1 3434 3434     1864 Sep 21 09:36 prometheus.yml
-rwxr-xr-x. 1 3434 3434 46672881 Jul 10 21:54 promtool
在prometheus.yml加如下配置,以取數據:
- job_name: 's1'
    static_configs:
    - targets: ['172.17.211.143:9200']
啟動:
./prometheus --config.file=prometheus.yml &8.3 配置Grafana
① 配置數據源

② 配置node_exporter模板
如選擇官方模板(ID:11074)的展示:

8.4 數據邏輯
做性能測試和分析,最重要是知道數據來源和含義。
如上圖CPU使用率,點擊title上的edit,看語句:
avg(irate(node_cpu_seconds_total{instance=~"$node",mode="system"}[30m])) by (instance)
avg(irate(node_cpu_seconds_total{instance=~"$node",mode="user"}[30m])) by (instance)
avg(irate(node_cpu_seconds_total{instance=~"$node",mode="iowait"}[30m])) by (instance)
1 - avg(irate(node_cpu_seconds_total{instance=~"$node",mode="idle"}[30m])) by (instance)
都是從Prometheus取出的數據,SQL讀Prometheus中node_cpu_seconds_total的不同的模塊數據。
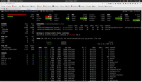
看node_exporter暴露的計數器:

值和top一樣,都來自/proc/目錄。如下即是top命令的數據:

因此,os中監控數據的取值邏輯:
? 從os本身的計數器取值
? 傳給Prometheus
? 再由Grafana中的query語句查出相應的數據
? 最后由Grafana展示
9 總結
為何專門解釋數據的邏輯?有人說有Prometheus+Grafana+Exportor,就無需再手工執行命令。
但監控平臺取的所有的數據,必然是被監控者可提供的數據,像node_exporter這樣小巧的監控收集器,可獲取的監控數據,并非整個系統全部的性能數據,只是取到常見計數器。
這些計數器不管用命令查看,還是用花里胡哨的工具,它的值本身都不會變。所以不管在監控平臺 or 命令行中看到的數據,最重要是知道含義及這些值的變化對性能測試和分析的下一步的影響。
JMeter如何把數據推送到Grafana中?
1.在JMeter中啟用插件:要將JMeter數據推送到Grafana中,您需要在JMeter中啟用插件。在JMeter的lib/ext目錄中找到JMeter插件管理器插件文件(JMeterPlugins-Manager.jar),并將其放置在該目錄中。重啟JMeter后,單擊“選項”菜單中的“插件管理器”,然后選擇“可選插件”選項卡。在這里,選擇“grafana-backendlistener”并單擊“應用更改”。
2.配置Grafana:打開Grafana中的數據源列表,選擇一個數據源(例如InfluxDB)并創建一個數據庫。請確保將數據庫名稱、用戶名和密碼配置為與JMeter對接的數據源的名稱、用戶名和密碼相同。
3.在JMeter中添加Backend Listener:在JMeter測試計劃中添加Backend Listener。在Backend Listener的屬性中,選擇“InfluxDBBackendListenerClient”作為Backend Listener實現,并按照屏幕上的說明設置InfluxDB的服務器和端口。
4.在Grafana中查看測試結果:創建一個Grafana儀表板,并選擇InfluxDB作為數據源。在儀表板上選擇一個面板,并將其設置為在Grafana中顯示JMeter測試結果的數據。
都是監控os計數器,監控平臺的數據和監控命令中的數據啥區別?
1.監控平臺是一個基于web或客戶端的可視化平臺,可以將實時的OS監控指標以圖表、表格等形式展示出來,以便于管理員進行查看與分析。
2.監控命令是一種命令行方式的工具,提供了豐富的OS監控指標查詢和分析功能。它通過在終端輸入不同的命令參數,實時獲取和顯示各種系統統計和性能指標。它主要用于開發和運維人員進行診斷和分析。
3.監控平臺是一種可配置、可擴展的監控方案,它可以幫助管理員實現對復雜的分布式應用的監控。而監控命令通常只能監控單個系統的指標。
4.監控平臺通常要安裝一個客戶端,以便向平臺發送數據。而在監控命令中,可以直接在終端輸入命令,獲取OS的監控指標。
綜上:
? 監控平臺提供GUI,便于管理員查看和管理指標數據
? 監控命令則更靈活,提供更多細節和具體信息