圖文結合丨Prometheus+Grafana+GreatSQL性能監控系統搭建指南
一、環境介紹
本文環境,以及本文所采用數據庫為GreatSQL 8.0.32-24
$ cat /etc/system-release
Red Hat Enterprise Linux Server release 7.9 (Maipo)
$ uname -a
Linux gip 3.10.0-1160.el7.x86_64 #1 SMP Tue Aug 18 14:50:17 EDT 2020 x86_64 x86_64 x86_64 GNU/Linux
$ ldd --version
ldd (GNU libc) 2.17
二、手動安裝
0.簡單介紹
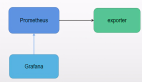
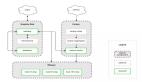
- Prometheus Server : 用于收集和存儲時間序列數據。
- Client Library : 客戶端庫,為需要監控的服務生成相應的 metrics 并暴露給 Prometheus server。當Prometheus server 來 pull 時,直接返回實時狀態的 metrics。
- Push Gateway : 主要用于短期的 jobs。由于這類 jobs 存在時間較短,可能在 Prometheus 來 pull 之前就消失了。為此,這次 jobs 可以直接向 Prometheus server 端推送它們的 metrics。這種方式主要用于服務層面的metrics,對于機器層面的 metrices,需要使用 node exporter。
- Exporters : 用于暴露已有的第三方服務的 metrics 給 Prometheus。
- Alertmanager : 從 Prometheus server 端接收到 alerts 后,會進行去除重復數據,分組,并路由到對收的接收方式,發出報警。常見的接收方式有:電子郵件,pagerduty,OpsGenie, webhook 等。
網上介紹很多這里就不再過多介紹了
1.安裝Prometheus
官網下載最新二進制安裝包? https://prometheus.io/download/
可以看到有很多的版本,這里選擇LTS的版本,LTS在軟件版本中通常表示Long Term Support,即長期支持版本。
對于Prometheus來說。LTS版本表示這個版本會獲得更長期的支持和維護,而非LTS版本則更新頻繁。新特性來得快。但穩定性和支持周期較短,所以在追求穩定的生產環境中。建議優先考慮使用LTS長期支持版本。
 圖片
圖片
這里選擇二進制軟件包prometheus-2.45.0.linux-amd64.tar.gz
$ mkdir /usr/local/prometheus
$ cd /usr/local/prometheus
$ wget https://github.com/prometheus/prometheus/releases/download/v2.45.0/prometheus-2.45.0.linux-amd64.tar.gz
下載完成后,用sha256sum校驗一下安裝包,沒問題的話解壓即可
$ sha256sum prometheus-2.45.0.linux-amd64.tar.gz
1c7f489a3cc919c1ed0df2ae673a280309dc4a3eaa6ee3411e7d1f4bdec4d4c5
$ tar xvf prometheus-2.45.0.linux-amd64.tar.gz
建議使用Systemd來管理守護進程Prometheus服務
若文件路徑或名字和本文不同記得修改
$ vi /lib/systemd/system/prometheus.service
[Unit]
Descriptinotallow=Prometheus server
Documentatinotallow=https://prometheus.io/docs/introduction/overview/
After=network-online.target

[Service]
Type=simple
User=root
Group=root
Restart=on-abnormal
ExecStart=/usr/local/prometheus/prometheus-2.45.0.linux-amd64/prometheus \
  --config.file=/usr/local/prometheus/prometheus-2.45.0.linux-amd64/prometheus.yml \
  --storage.tsdb.path=/usr/local/prometheus/prometheus-2.45.0.linux-amd64/data \
  --storage.tsdb.retention.time=60d \
  --web.enable-lifecycle

[Install]
WantedBy=multi-user.target
使用$ ./prometheus -h 就可以看到幫助信息
通知Systemd重新加載配置文件
$ systemctl daemon-reload以下為相關Systemd命令$ systemctl enable prometheus # 設置為開機自啟$ systemctl disable prometheus # 關閉開機自啟$ systemctl start prometheus # 開啟服務$ systemctl status prometheus # 查看狀態$ systemctl restart prometheus # 重啟服務$ systemctl stop prometheus # 停止服務
啟動Prometheus server,并查看是否啟動成功active (running)
$ systemctl start prometheus.service

$ systemctl status prometheus.service
● prometheus.service - Prometheus server
   Loaded: loaded (/usr/lib/systemd/system/prometheus.service; disabled; vendor preset: disabled)
   Active: active (running) since 三 2023-09-06 16:14:34 CST; 2s ago
     Docs: https://prometheus.io/docs/introduction/overview/
 Main PID: 21472 (prometheus)
   CGroup: /system.slice/prometheus.service
           └─21472 /usr/local/prometheus/prometheus-2.45.0.linux-amd64/prometheus --config.file=/usr/local/prometheus/prometheus-2.45.0.linux-amd64/prometheus.yml --storage.tsdb.path=/usr/local/pr...
#下方省略
若啟動失敗可自行排查 $ journalctl -u prometheus.service -f
訪問地址
名稱 | 地址 |
prometheus | |
監控指標 |
界面如下
安裝完成Prometheus,接下來安裝Alertmanager
2.安裝Alertmanager
官網下載? https://prometheus.io/download/
這里我們選擇alertmanager-0.26.0.linux-amd64.tar.gz
$ cd /usr/local/prometheus
$ wget https://github.com/prometheus/alertmanager/releases/download/v0.26.0/alertmanager-0.26.0.linux-amd64.tar.gz
下載完成后,用sha256sum校驗一下安裝包,沒問題的話解壓即可
$ sha256sum alertmanager-0.26.0.linux-amd64.tar.gz
abd73e2ee6bf67d3888699660abbecba7b076bf1f9459a3a8999d493b149ffa6
$ tar xvf alertmanager-0.26.0.linux-amd64.tar.gz
建議使用Systemd來管理守護進程Alertmanager服務
若文件路徑或名字,和下方示例不同記得修改
$ vi /lib/systemd/system/alertmanager.service
[Unit]
Descriptinotallow=Alert Manager
Wants=network-online.target
After=network-online.target

[Service]
Type=simple
User=root
Group=root
Restart=always
ExecStart=/usr/local/prometheus/alertmanager-0.26.0.linux-amd64/alertmanager \
  --config.file=/usr/local/prometheus/alertmanager-0.26.0.linux-amd64/alertmanager.yml \
  --storage.path=/usr/local/prometheus/alertmanager-0.26.0.linux-amd64/data

[Install]
WantedBy=multi-user.target
通知Systemd重新加載配置文件
$ systemctl daemon-reload啟動alertmanager.service
$ systemctl start alertmanager.service若啟動失敗可自行排查journalctl -u alertmanager.service -f
訪問地址
應用名稱 | 地址 |
Alertmanager |
Alertmanager界面如下
添加Prometheus配置
因為我們安裝了Alertmanager,所以需要添加到Prometheus里面
$ vi /usr/local/prometheus/prometheus-2.45.0.linux-amd64/prometheus.yml把# - alertmanager:9093修改為localhost:9093
因為我們是裝在同一個機器上,所以是localhost,若安裝不在同一個機器上請修改為正確IP地址
# Alertmanager configuration
alerting:
  alertmanagers:
    - static_configs:
        - targets:
          - localhost:9093 <--修改這里,注意縮進
注意!yml文件是有縮進格式的,修改時不要打亂原有格式
在rule_files:添加- "alert.yml",前面縮進只需保留兩格!
# Load rules once and periodically evaluate them according to the global 'evaluation_interval'.
rule_files:
  - "alert.yml"  <--添加這里,注意縮進2格即可
  # - "first_rules.yml"
  # - "second_rules.yml"
增加觸發器配置文件
編輯新文件alert.yml添加以下內容,注意格式縮進
$ vi /usr/local/prometheus/prometheus-2.45.0.linux-amd64/alert.yml

groups:
- name: Prometheus alert
  rules:
  # 任何實例超過30s無法聯系的情況發出告警
  - alert: 服務告警
    expr: up == 0
    for: 30s
    labels:
      severity: critical
    annotations:
      instance: "{{ $labels.instance  }}"
      description: "{{ $labels.job  }} 服務已關閉"
檢查一下配置文件,與下方一致即為成功
$ cd /usr/local/prometheus/prometheus-2.45.0.linux-amd64
$ ./promtool check config prometheus.yml
Checking prometheus.yml
  SUCCESS: 1 rule files found
 SUCCESS: prometheus.yml is valid prometheus config file syntax

Checking alert.yml
  SUCCESS: 1 rules found
接下來重啟一下Prometheus或重新加載配置文件
$ systemctl restart prometheus
# 二選一即可
$ curl -X POST http://localhost:9090/-/reload
再次訪問http://172.17.137.104:9093/,并檢查Status,確認沒有問題
 圖片
圖片
3.安裝Grafana
官網下載Grafana? https://grafana.com/grafana/download
進入官網后選擇Linux,下方會展示出安裝方式,這里選擇二進制的方式安裝
$ wget https://dl.grafana.com/enterprise/release/grafana-enterprise-10.1.1.linux-amd64.tar.gz
$ tar -zxvf grafana-enterprise-10.1.1.linux-amd64.tar.gz
創建 Systemd 服務
$ vi /lib/systemd/system/grafana-server.service
[Unit]
Descriptinotallow=Grafana server
Documentatinotallow=https://doce.grafana.org

[Service]
Type=simple
User=root
Group=root
Restart=on-abnormal
ExecStart=/usr/local/prometheus/grafana-10.1.1/bin/grafana-server \
  --cnotallow=/usr/local/prometheus/grafana-10.1.1/conf/defaults.ini \
  --homepath=/usr/local/prometheus/grafana-10.1.1

[Install]
WantedBy=multi-user.target
通知 Systemd 重新加載配置文件
$ systemctl daemon-reload啟動grafana-server.service
$ systemctl start grafana-server.service若啟動失敗可自行排查journalctl -u grafana-server.service -f
訪問地址:
應用名稱 | 地址 |
Grafana |
 圖片
圖片
沒問題安裝成功!
4.安裝node_exporter
下載node_exporter? https://prometheus.io/download/
下拉網頁找到node_exporter選擇對應文件名下載即可
$ wget https://github.com/prometheus/node_exporter/releases/download/v1.6.1/node_exporter-1.6.1.linux-amd64.tar.gz
#驗證一下是否下載完整
$ sha256sum node_exporter-1.6.1.linux-amd64.tar.gz
$ tar -xvf node_exporter-1.6.1.linux-amd64.tar.gz
創建 Systemd 服務
$ vi /lib/systemd/system/node_exporter.service
[Unit]
Descriptinotallow=node_exporter
Documentatinotallow=https://prometheus.io/
After=network.target
[Service]
Type=simple
User=root
Group=root
Restart=on-abnormal
ExecStart=/usr/local/prometheus/node_exporter-1.6.1.linux-amd64/node_exporter

[Install]
WantedBy=multi-user.target
通知 Systemd 重新加載配置文件
$ systemctl daemon-reload啟動alertmanager.service
$ systemctl start node_exporter.service若啟動失敗可自行排查journalctl -u node_exporter.service -f
node_exporter訪問地址
應用名稱 | 地址 |
node_exporter |
添加Prometheus配置
安裝完成后還需要添加Prometheus配置,為避免大家打錯,這里采用追加寫入
$ cat >> /usr/local/prometheus/prometheus-2.45.0.linux-amd64/prometheus.yml <<"EOF"
# 在scrape_configs這行下面添加配置
  - job_name: "node-exporter"
    scrape_interval: 15s
    static_configs:
      - targets: ["localhost:9100"]
        labels:
          instance: prometheus服務器
EOF
重載Prometheus配置
$ curl -X POST http://localhost:9090/-/reloadPrometheus web上檢查一下 http://172.17.137.104:9090/點擊Status->Targets
可以看到有node_exporter,以及可以檢查下我們配置的觸發器Alerts->勾選Inactive
至此,通過二進制安裝Prometheus就到此完成!
三、使用Grafana
1. 添加Prometheus數據源
我們可以進入Grafana對監控的內容做一個圖形的展示,登入http://172.17.137.104:3000/
 圖片
圖片
輸入默認用戶名admin,默認密碼admin,之后會提示你修改密碼,然后就成功登入Grafana
 圖片
圖片
進入后添加Prometheus的數據源,在Connections里有Data sources,總之找到Data sources即可
 圖片
圖片
點擊Add data source選擇Prometheus,進入配置
在紅框處填寫Prometheus地址,因為本文部署在本機,所以是localhost,填寫完成后滑動頁面到最下方,點擊Save & test保存和測試
2.導入Grafana儀表盤
下載Grafana儀表盤? https://grafana.com/grafana/dashboards/
 圖片
圖片
紅框框起來的就是我們需要下載的Node Exporter Full,如果首頁沒有展示的話,可以直接搜索
點擊進去,選擇Copy ID to clipboard復制ID
 圖片
圖片
進入http://172.17.137.104:3000/到Grafana上,選擇Dashboards,點擊New
選擇Import
在紅框處粘貼剛剛復制的,其實也就是1860,接著點擊LOAD加載
 圖片
圖片
可以修改一下名字,在選擇下Prometheus點擊Import導入即可
 圖片
圖片
這樣就完成了Grafana對Prometheus數據的展示
四、監控GreatSQL
不建議采用GreatSQL的root用戶監控,因為root的權限非常大,所以我們進入GreatSQL先創建一個用于監控的用戶
greatsql> CREATE USER 'exporter'@'localhost' IDENTIFIED BY 'GreatSQL@666';
greatsql> GRANT PROCESS,REPLICATION CLIENT,SELECT ON *.* TO 'exporter'@'localhost';
接下來需要安裝mysqld_exporter,本文依舊采用二進制方式安裝
在https://prometheus.io/download/中找到mysqld_exporter,下載即可
$ wget https://github.com/prometheus/mysqld_exporter/releases/download/v0.15.0/mysqld_exporter-0.15.0.linux-amd64.tar.gz
#驗證一下是否下載完整
$ sha256sum mysqld_exporter-0.15.0.linux-amd64.tar.gz
$ tar -xvf mysqld_exporter-0.15.0.linux-amd64.tar.gz
創建一個連接數據庫的文件.mysqld_exporter.cnf
$ vi /usr/local/prometheus/mysqld_exporter-0.15.0.linux-amd64/.mysqld_exporter.cnf
#填入以下內容即可
[client]
user=exporter
password=GreatSQL@666
host=localhost
port=3306
創建 Systemd 服務
$ vi /lib/systemd/system/mysqld_exporter.service
[Unit]
Descriptinotallow=Prometheus GreatSQL
After=network.target

[Service]
Type=simple
User=root
Group=root
Restart=always
ExecStart=/usr/local/prometheus/mysqld_exporter-0.15.0.linux-amd64/mysqld_exporter \
  --config.my-cnf=/usr/local/prometheus/mysqld_exporter-0.15.0.linux-amd64/.mysqld_exporter.cnf \
  --collect.global_status \
  --collect.auto_increment.columns \
  --collect.info_schema.processlist \
  --collect.binlog_size \
  --collect.info_schema.tablestats \
  --collect.global_variables \
  --collect.info_schema.innodb_metrics \
  --collect.info_schema.query_response_time \
  --collect.info_schema.userstats \
  --collect.info_schema.tables \
  --collect.perf_schema.tablelocks \
  --collect.perf_schema.file_events \
  --collect.perf_schema.eventswaits \
  --collect.perf_schema.indexiowaits \
  --collect.perf_schema.tableiowaits \
  --collect.slave_status \
  --collect.perf_schema.replication_group_members \
  --collect.perf_schema.replication_group_member_stats \
  --web.listen-address=0.0.0.0:9104

[Install]
WantedBy=multi-user.target
通知 Systemd 重新加載配置文件
$ systemctl daemon-reload啟動alertmanager.service
$ systemctl start mysqld_exporter.service若啟動失敗可自行排查journalctl -u mysqld_exporter.service -f
訪問一下看看能否成功http://172.17.137.104:9104
1.添加Prometheus配置
安裝完成后還需要添加Prometheus配置,為避免大家打錯,這里采用追加寫入
$ cat >> /usr/local/prometheus/prometheus-2.45.0.linux-amd64/prometheus.yml <<"EOF"
# mysqld-exporter配置
  - job_name: "mysqld-exporter"
    static_configs:
      - targets: ["localhost:9104"]
        labels:
          instance: prometheus服務器
EOF
重載Prometheus配置
$ curl -X POST http://localhost:9090/-/reloadPrometheus web上檢查一下 http://172.17.137.104:9090/,點擊Status->Targets

2.增加觸發器配置文件
編輯prometheus.yml在rule_files:添加- "alert.yml",前面縮進只需保留兩格!
$ vi /usr/local/prometheus/prometheus-2.45.0.linux-amd64/prometheus.yml

# Load rules once and periodically evaluate them according to the global 'evaluation_interval'.
rule_files:
  - "alert.yml"
  - "rules/*.yml"  <-添加這里,注意縮進2格即可
  # - "first_rules.yml"
  # - "second_rules.yml"
表示把rules文件夾下的所有yml文件都導入進來
$ mkdir /usr/local/prometheus/prometheus-2.45.0.linux-amd64/rules
$ vi /usr/local/prometheus/prometheus-2.45.0.linux-amd64/rules/mysqld.yml
groups:
- name: GreatSQL
  rules:
  # 任何實例超過30s無法聯系的情況發出告警
  - alert: GreatSQLDown
    expr: mysql_up == 0
    for: 30s
    labels:
      severity: critical
    annotations:
      summary: "GreatSQL Down,實例:{{ $labels.instance }}"
      description: "連接不上GreatSQL了,當前狀態為:{{ $value }}"
類似的告警信息都可以自行編寫
檢查一下配置文件,出現SUCCESS: prometheus.yml is valid prometheus config file syntax即為成功
$ cd /usr/local/prometheus/prometheus-2.45.0.linux-amd64
$ ./promtool check config prometheus.yml
Checking prometheus.yml
  SUCCESS: 2 rule files found
 SUCCESS: prometheus.yml is valid prometheus config file syntax
Checking alert.yml
  SUCCESS: 1 rules found
Checking rules/mysqld.yml
  SUCCESS: 1 rules found
接下來重啟一下 Prometheus 或重新加載配置文件
$ systemctl restart prometheus
# 二選一即可
$ curl -X POST http://localhost:9090/-/reload
再次訪問http://172.17.137.104:9093/,并檢查Status,確認沒有問題
3.導入Grafana儀表盤
展示 Prometheus 從 mysql_exporter 收集到的數據,添加儀表盤ID7362
 圖片
圖片
修改名稱后點擊Import即可
 圖片
圖片
可以看到頁面中已經展示了許多內容,例如GreatSQL數據庫運行的時間,QPS值,InnoDB Buffer Pool Size,Buffer Poll of Total RAM等
這里Buffer Poll of Total RAM值有些低,說明設置的InnoDB buffer pool大小不對,應該設置約占用總內存的50%到75%,這樣可以合理利用內存,提高緩存命中率。
來簡單看幾個監控項目的意義和內容
- MySQL Connections,監控GreatSQL的連接數,有最大連接數及最大使用連接數
- MySQL Client Thread Activity,監控GreatSQL的活動線程數,有連接線程數(Threads Connected)和運行線程數(Threads Running)
- MySQL Table Locks,監控GreatSQL的表鎖,我們可以看到GreatSQL從存儲引擎請求了多少表級鎖。在InnoDB的情況下,很多時候鎖實際上可能是行鎖,因為它只在少數特定情況下使用表級鎖。比較“立即鎖定”和“等待鎖定”最有用。如果等待的鎖數正在上升,則表示存在鎖爭用。否則,鎖立即上升和下降是正常活動。
查看下QPS是如何監控的,鼠標移動到內容的右上角,會出現三個點,點擊Edit,進入編輯
 圖片
圖片
可以看到如下內容
 圖片
圖片
這段監控規則中使用了rate()和irate()函數來計算GreatSQL queries狀態計數器的速率。
- mysql_global_status_queries{instance="$host"} 表示提取實例host的queries全局狀態計數器。
- rate()函數計算該計數器在$interval時間段內的每秒速率。
- irate()函數計算該計數器在最近5分鐘的每個瞬時速率。
- 或運算符表示取這兩者中的較大值。
如果覺得你想監控的內容沒有你想要的,可以點擊右上角Add,點擊Visualization添加監控內容
 圖片
圖片
例如我想添加一個group_replication_flow_control_countMGR累計觸發流控的次數,在Select metric中搜索想監控的狀態,
 圖片
圖片
label標簽
Label filters用于過濾和選擇時間序列數據。它可以針對特定的標簽值來選擇顯示哪些時間序列。
例如instance="192.168.1.1:9090"表示只選擇instance標簽值為"192.168.1.1:9090"的時間序列。
可以在Grafana的面板中使用Label filters字段來指定過濾條件,其作用主要包括:
- 選擇特定實例的數據:如instance="A" 只看實例A的數據
- 查看特定模式匹配的實例:如instance=~"10\\.8\\..*"選取符合模式的實例
- 查看某個狀態的序列:state="200" 只看狀態碼為200的
- 組合多個標簽進行過濾: instance=~"1\\d\\.8\\..*",state!="500"
- 也可以直接輸入PromQL進行各種復雜過濾
Operations
Operations選項允許對查詢結果進行各種操作,常用的操作及含義如下:
- Rate:計算計數器的增長速率,常用于計數器指標的速率轉換,如QPS。
- Delta:計算時間序列的增量變化值。
- Derivative:計算時間序列的一階導數,表示瞬時變化率。
- Integral:對時間序列求積分,計算面積圖。
- Aggregation:對結果series做聚合,如平均,最大最小值等。
- Transform:進行數學變換,如log等。
- Aliasing:結果串進行重命名。
- Group by:分組歸類。
我們可以選中Metric后,在Operations下拉列表中選擇所需要的計算操作。這些操作無需修改PromQL查詢語句,在結果集上進行,可以方便地衍生出新的時間序列。例如可以將 COUNTER 計數器轉換為 QPS 速率等。這為Grafana提供了靈活的統計和分析能力。
添加完成參數后點擊Apply應用即可,回到界面上就可以看到剛剛添加的監控項了
 圖片
圖片
記得要對整個儀表盤也保存,點擊右上角圖標如下所示,保存即可
 圖片
圖片
也可以對表的情況進行監控,只需導入儀表盤ID9625
 圖片
圖片
至此,通過Prometheus監控GreatSQL到此結束,下部文章將介紹如何使用告警功能