Python 自動化:eip、cen監控數據對接到grafana
概覽
日常運維中,我們有時需要關注阿里云中 EIP 和 CEN 的監控數據,如果每次登錄到平臺查看,不太方便。
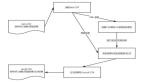
可以通過 API 獲取監控數據,并輸入到 influxDB,然后再到 Grafana 中展示,以便進行實施監控和可視化。
第一步:準備工作
在開始之前,我們需要確保已經完成以下準備工作
準備阿里云的EIP和CEN實例
這一步省略
了解如何獲取EIP和CEN數據
了解如何獲取 EIP 和 CEN 數據
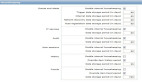
我的方式是 EIP 通過 EIP 產品的 API 獲取的,調試鏈接如下
輸入 RegionId 和 AllocationId 等必選信息后,復制平臺生成的代碼,進行更改,下文會介紹如何更改
 圖片
圖片
CEN 的監控數據未找到具體的 API,但可以通過云監控的數據獲取,也是很方便的,鏈接如下
https://api.aliyun.com/api/Cms/2019-01-01/DescribeMetricData
獲取 CEN 的具體數據時,可以通過 https://cms.console.aliyun.com/metric-meta/acs_cen/cen_tr?spm=a2c4g.11186623.0.0.252476ab1Ldq0T 得到
實際上,EIP 的數據也可以通過云監控獲取
安裝Python和所需的依賴庫
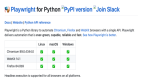
下面示例的版本是截止發文時間最新版本,實際使用時,可以登錄到上面的阿里云開放平臺查看最新的版本
pip install alibabacloud_vpc20160428==5.1.0
pip install alibabacloud_cms20190101==2.0.11
安裝InfluxDB,并進行初始化配置
1. 為方便使用,我這里是使用 Docker 運行的 Influxdb
cd /data/influxdb


# 生成初始的配置文件
docker run --rm influxdb:2.7.1 influxd print-config > config.yml


# 啟動容器
docker run --name influxdb -d -p 8086:8086 --volume `pwd`/influxdb2:/var/lib/influxdb2 --volume `pwd`/config.yml:/etc/influxdb2/config.yml influxdb:2.7.1
2. 安裝完成后,可通過 http://ip:8086 登錄到 Influxdb
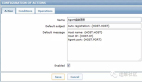
3. 創建 bucket
只需要創建一個 bucket 就可以了,bucket 類似 MySQL 的 database
4. 獲取 API Token,在 Python 插入數據時會用到
安裝Grafana,并進行基本的配置
省略
第二步:獲取API訪問憑證
為了能夠通過API訪問阿里云的 EIP 和 CEN 數據,我們需要獲取訪問憑證。具體步驟如下
- 登錄阿里云控制臺
- 創建 RAM 用戶并分配相應的權限
- 獲取 RAM 用戶的 Access Key ID 和 Access Key Secret
第三步:編寫Python腳本
使用Python編寫腳本來獲取 EIP 和 CEN 的監控數據,并將其存儲到 InfluxDB 中
本文僅展示部分代碼,如需完整的代碼,請聯系本公眾號獲取~
調整從阿里云復制的示例代碼
1. 修改構造函數,可以傳如 access_key_id 和 access_key_secret
def __init__(self, access_key_id: str=access_key_id, access_key_secret: str=access_key_secret):
        self.access_key_id = access_key_id
        self.access_key_secret = access_key_secret
2. 修改獲取 eip 數據的函數
def get_eip_monitor_data(self, region_id, allocation_id, start_time: str, end_time: str):
        '''
        參考文檔:
        https://api.aliyun.com/api/Vpc/2016-04-28/DescribeEipMonitorData?params={%22RegionId%22:%22cn-hangzhou%22}


        Args:
            region_id (_type_): _description_
            allocation_id (_type_): _description_
            start_time (str): utc時間
            end_time (_type_): utc時間


        Yields:
            _type_: _description_
            eip_tx: 流出的流量。單位: Byte
            eip_rx: 流入的流量。單位: Byte
        '''
        # 請確保代碼運行環境設置了環境變量 ALIBABA_CLOUD_ACCESS_KEY_ID 和 ALIBABA_CLOUD_ACCESS_KEY_SECRET。
        # 工程代碼泄露可能會導致 AccessKey 泄露,并威脅賬號下所有資源的安全性。以下代碼示例使用環境變量獲取 AccessKey 的方式進行調用,僅供參考,建議使用更安全的 STS 方式,更多鑒權訪問方式請參見:https://help.aliyun.com/document_detail/378659.html
        client = self.create_client(endpoint=f'vpc.{region_id}.aliyuncs.com', access_key_id=self.access_key_id, access_key_secret=self.access_key_secret)
        describe_eip_monitor_data_request = vpc_20160428_models.DescribeEipMonitorDataRequest(
            region_id=region_id,
            allocation_id=allocation_id,
            start_time=start_time,
            end_time=end_time
        )
        log.debug(msg=describe_eip_monitor_data_request)
        runtime = util_models.RuntimeOptions()
        log.debug(msg=runtime)
        try:
            # 復制代碼運行請自行打印 API 的返回值
            results = client.describe_eip_monitor_data_with_options(describe_eip_monitor_data_request, runtime).body.eip_monitor_datas.eip_monitor_data
            for result in results:
                yield result


        except Exception as error:
            log.error(msg=error)
            return UtilClient.assert_as_string(error.message)
3. 修改獲取 cen 數據的函數
def get_cen_monitor_data(self, namespace, metric_name, start_time: str, end_time: str):
        # 請確保代碼運行環境設置了環境變量 ALIBABA_CLOUD_ACCESS_KEY_ID 和 ALIBABA_CLOUD_ACCESS_KEY_SECRET。
        # 工程代碼泄露可能會導致 AccessKey 泄露,并威脅賬號下所有資源的安全性。以下代碼示例使用環境變量獲取 AccessKey 的方式進行調用,僅供參考,建議使用更安全的 STS 方式,更多鑒權訪問方式請參見:https://help.aliyun.com/document_detail/378659.html
        client = self.create_client(access_key_id=self.access_key_id, access_key_secret=self.access_key_secret)
        describe_metric_list_request = cms_20190101_models.DescribeMetricListRequest(
            namespace=namespace,
            metric_name=metric_name,
            start_time=start_time,
            end_time=end_time,
        )
        runtime = util_models.RuntimeOptions()
        try:
            # 復制代碼運行請自行打印 API 的返回值
            return client.describe_metric_list_with_options(describe_metric_list_request, runtime).body.datapoints


        except Exception as error:
            # 如有需要,請打印 error
            UtilClient.assert_as_string(error.message)
編寫InfluxDB相關的代碼
將 InfluxDB 的寫入代碼獨立出來可以方便后續其他業務的調用
下面的代碼在獲取 token 時,使用了 1password,可視情況進行修改,例如通過環境變量的方式獲取 Token
#!/usr/bin/env python3


import influxdb_client, time
import datetime
from influxdb_client import InfluxDBClient, Point, WritePrecision
from influxdb_client.client.write_api import SYNCHRONOUS
from modules.onepassword import OnePassword


my1p = OnePassword()


class InfluxClient:
    token = my1p.get_item_by_title(title='my_influxdb')['api']
    def __init__(self, url: str='http://10.1.1.1:8086', org: str='tyun', token: str=token):
        self.url = url
        self.org = org
        self.token = token

    def create_client(self):
        return influxdb_client.InfluxDBClient(url=self.url, token=self.token, org=self.org)


    def write_aliyun_eip(self, bucket: str='example', table_name: str='test1', location: str=None, eip_tx: int=None, eip_rx: int=None, time_stamp: str=None):
        write_api = self.create_client().write_api(write_optinotallow=SYNCHRONOUS)


        point = (
            Point(table_name)
            .tag("location", location)
            .field("eip_tx", eip_tx)
            .field("eip_rx", eip_rx)
            .time(time_stamp)
        )
        write_api.write(bucket=bucket, org=self.org, record=point)


    def write_cen(self, bucket: str='example', table_name: str='test1', location: str=None, tr_instance_id: str=None, value: int=None, time_stamp: str=None):
        write_api = self.create_client().write_api(write_optinotallow=SYNCHRONOUS)
        point = (
            Point(table_name)
            .tag("location", location)
            .tag("tr_instance_id", tr_instance_id)
            .field("value", value)
            .time(time_stamp)
        )
        write_api.write(bucket=bucket, org=self.org, record=point)


def main():
    influx_client = InfluxClient()
    for i in range(5):
        influx_client.write_data(bucket='example', table_name='test1', locatinotallow='hangzhou', EipBandwidth=i, EipFlow=i)
        time.sleep(1)


if __name__ == '__main__':
    main()
編寫主程序
1. 獲取 eip 并插入到 influxdb
#!/usr/bin/env python3


from collections import namedtuple
from modules.aliyun.eip import Eip
from modules.database.influxdb.write import InfluxClient
from modules.tools.my_time import MyDatetime as my_time


eip = Eip()
influx_client = InfluxClient()


def insert_data(region_id, location, table_name, allocation_id, start_time, end_time):
    '''
    _summary_


    Args:
        region_id (_type_): _description_
        location (_type_): _description_
        table_name (_type_): _description_
        allocation_id (_type_): _description_
        start_time (_type_): _description_
        interval (int, optional): 取值的范圍, 默認是5.
    '''


    eip_datas = eip.get_eip_monitor_data(region_id=region_id, allocation_id=allocation_id, start_time=start_time, end_time=end_time)
    for eip_data in eip_datas:
        # print(eip_data)
        influx_client.write_aliyun_eip(bucket='example',
                                       table_name=table_name,
                                       locatinotallow=location,
                                       eip_rx=eip_data.eip_rx,
                                       eip_tx=eip_data.eip_tx,
                                       time_stamp=eip_data.time_stamp)


Instance = namedtuple('Instance', ['region_id', 'allocation_id', 'bandwidth', 'env'])


hangzhou = Instance(region_id='hangzhou', allocation_id='eip-xxxxxxxxx', bandwidth='100m', env='prod')


eip_site_list = [hangzhou]


for eip_site in eip_site_list:
    insert_data(region_id=f'cn-{eip_site.region_id}',
                locatinotallow=f'cn-{eip_site.region_id}',
                table_name='eip',
                allocation_id=eip_site.allocation_id,
                start_time=my_time.get_utc_now_str_offset(offset=-60*10),
                end_time=my_time.get_utc_now_str()
                )
2. 獲取 cen 數據并插入到 influxdb
#!/usr/bin/env python3


import ast
from modules.aliyun.metrics import Metrics
from modules.database.influxdb.write import InfluxClient
from modules.tools.my_time import MyDatetime as my_time
from modules.logger.client import LogClient


metrics = Metrics()
influx_client = InfluxClient()
log = LogClient(app='example_traffic')


def tr_instance_id_to_location(tr_instance_id):
    if tr_instance_id == 'tr-xxxxxxxxxxxxx':
        location = 'hangzhou'
        bandwidth = '20m'
    else:
        location = 'none'
    return location, bandwidth


metric_names = ['AttachmentOutRate', 'AttachmentInRate']


for metric_name in metric_names:
    results = metrics.get_cen_monitor_data(namespace='acs_cen',
                                           metric_name=metric_name,
                                           start_time=my_time.get_utc_now_str_offset(offset=-60*10),
                                           end_time=my_time.get_utc_now_str())
    log.debug(msg=results)


    for result in ast.literal_eval(results):
        result['metric_name'] = metric_name
        trInstanceId = result['trInstanceId']
        result['location'] = tr_instance_id_to_location(tr_instance_id=trInstanceId)[0]
        result['bandwidth'] = tr_instance_id_to_location(tr_instance_id=trInstanceId)[1]

        log.info(msg=metric_name + ' ' + my_time.timestamp_to_str(timestamp=result['timestamp']) + ' ' + ' ' + result['location'] + ' ' + str(result['Value']))


        influx_client.write_cen(bucket='example',
                                table_name=metric_name,
                                locatinotallow=result['location'],
                                tr_instance_id=result['trInstanceId'],
                                value=result['Value'],
                                time_stamp=my_time.timestamp_to_str(timestamp=result['timestamp']))
第四步:配置Grafana
在Grafana中配置 InfluxDB 數據源,并創建相應的儀表盤來展示 EIP 和 CEN 的監控數據。具體步驟如下:
- 添加 InfluxDB 數據源,并配置連接信息我用的是 Flux 的查詢語言,配置數據源時,需要注意以下事項:
數據源名字推薦使用:InfluxDB-Flux,注明是 Flux 類型的數據源
InfluxDB Details 填寫 Organization、Token、Default Bucket 即可
不用填寫 HTTP 認證
- 創建儀表盤,配置 eip 和 cen 的查詢語句· EIP 接收方向的流量
from(bucket: "example")
  |> range(start: v.timeRangeStart, stop: v.timeRangeStop)
  |> filter(fn: (r) => r["_measurement"] == "eip")
  |> filter(fn: (r) => r["_field"] == "eip_rx")
  |> filter(fn: (r) => r["location"] == "cn-hangzhou")
  |> aggregateWindow(every: v.windowPeriod, fn: last, createEmpty: false)
  |> map(fn: (r) => ({ r with _value: r._value / 8 }))
|> yield(name: "last")- EIP 發送方向的流量
from(bucket: "example")
  |> range(start: v.timeRangeStart, stop: v.timeRangeStop)
  |> filter(fn: (r) => r["_measurement"] == "eip")
  |> filter(fn: (r) => r["_field"] == "eip_tx")
  |> filter(fn: (r) => r["location"] == "cn-hangzhou")
  |> aggregateWindow(every: v.windowPeriod, fn: last, createEmpty: false)
  |> map(fn: (r) => ({ r with _value: r._value / 8 }))
|> yield(name: "last")- CEN 發送方向的流量
from(bucket: "example")
  |> range(start: v.timeRangeStart, stop: v.timeRangeStop)
  |> filter(fn: (r) => r["_measurement"] == "AttachmentOutRate")
  |> filter(fn: (r) => r["_field"] == "value")
  |> filter(fn: (r) => r["location"] == "hangzhou")
  |> aggregateWindow(every: v.windowPeriod, fn: last, createEmpty: false)
|> yield(name: "last")- CEN 接收方向流量
from(bucket: "example")
  |> range(start: v.timeRangeStart, stop: v.timeRangeStop)
  |> filter(fn: (r) => r["_measurement"] == "AttachmentInRate")
  |> filter(fn: (r) => r["_field"] == "value")
  |> filter(fn: (r) => r["location"] == "hangzhou")
  |> aggregateWindow(every: v.windowPeriod, fn: last, createEmpty: false)
|> yield(name: "last")- eip 和 cen 的數據單位都是 bit/sec(SI)
- 建議配置 Grafana 面板的 Thresholds
100M為 100000000,配置后會顯示一條紅線,可以更直觀的看到流量的占用情況
總結
通過本文的步驟,我們可以通過API獲取阿里云 EIP 和 CEN 的監控數據,將其存儲到 InfluxDB,并通過 Grafana 進行實時監控和可視化。這為我們提供了一種自動化的方式來監控和管理阿里云網絡資源。