使用Python代碼識別股票價格圖表模式
在股票市場交易的動態環境中,技術和金融的融合催生了分析市場趨勢和預測未來價格走勢的先進方法。本文將使用Python進行股票模式識別。
from collections import defaultdict

 import numpy as np
 import pandas as pd
 import matplotlib.pyplot as plt
 from scipy.signal import argrelextrema
 from statsmodels.nonparametric.kernel_regression import KernelReg
 from yahoofinancials import YahooFinancials
上面的庫中,有幾個要點需要介紹:
collections.defaultdict:當缺少鍵時,返回默認值。使用它可以有效地存儲和組織數據,比如鍵反映日期或資產符號等可識別的度量,值表示相應的變量。
argrelextrema函數是SciPy庫中的一個函數,用于進行科學計算和技術計算。它有助于識別價格數據中的局部最大值和最小值,指示價格數據中的潛在轉折點或支撐位和阻力位。
statsmodels.nonparametric.kernel_regression.KernelReg:這個來自statmodels的子模塊提供了非參數核回歸功能。交易可以使用這種方法來擬合價格數據的平滑曲線,以確定趨勢,無需假設曲線具有特定的參數形式。
YahooFinancials:該模塊從雅虎財經獲取財務數據。我們可以訪問大量的財務數據,包括股票價格,財務報表和其他市場數據,用于分析和決定如何處理投資組合。
start_date = '2017-01-01'
 end_date = '2017-12-31'
 stock_code = 'FB' # e.g. AMZN, GOOG, FB, NVDA
我們獲取的股票數據是在2017-01-01至2017-12-31期間。作為stock_code變量,Facebook, Inc.被設置為FB,即股票的代碼。
在指定的日期范圍內,交易算法將執行該股票代碼的數據分析、交易信號或實際交易等操作。此代碼的目的是為交易算法建立基本參數:目標時間框架和交易的特定股票。
變量最終將在代碼中用于獲取歷史數據、執行財務分析和回溯測試交易策略。對于任何專注于股票市場的交易系統,這些參數是評估歷史表現和執行實時交易的關鍵輸入。
def preprocess_data(start_date, end_date, stock_code):
    stock_data = YahooFinancials(stock_code).get_historical_price_data(start_date, end_date, 'daily')
    price_data = stock_data[stock_code]['prices']
    columns = ['formatted_date', 'open', 'high', 'low', 'close', 'adjclose', 'volume']
    new_columns = ['Date', 'Open', 'High', 'Low', 'Close', 'Adj Close', 'Volume']
    df = pd.DataFrame(data=price_data)[columns] # order dataframe columns
    df = df.rename(index=str, columns=dict(zip(columns, new_columns))) # rename dataframe columns
    return df, df['Close'], df['Date']
preprocess_data有三個參數:start_date、end_date和stock_code,它們指定時間范圍和股票類型。此函數的主要目標是從Financials檢索給定股票的指定日期范圍內的歷史股票價格。
獲取包括全面的金融信息,包括每日股票價格、開盤價、最高價和最低價,以及調整后的收盤價。獲得數據后,將其組織到pandas DataFrame中,通過重命名列,可以實現更好的可讀性和與通用財務數據標準的一致性。該函數返回處理后的DataFrame以及兩個Series一維數組,其中包括收盤價和收盤價發生的日期。
df, prices, dates = preprocess_data(start_date, end_date, stock_code)
 prices.index = np.linspace(1, len(prices), len(prices))
 dates.index = np.linspace(1, len(dates), len(dates))
我們為兩組數據(價格和日期)設置索引。然后就是對價格的分析和局部最大值和最小值的識別,這對交易者來說是非常寶貴的。代碼采用了一個核心回歸模型,消除價格的周期性波動,從而更容易發現重要的趨勢。
# https://onlinelibrary.wiley.com/doi/full/10.1111/0022-1082.00265
 # reference: https://www.quantopian.com/posts/an-empirical-algorithmic-evaluation-of-technical-analysis
 def find_max_min(prices):
    model = KernelReg(prices.values, prices.index.values, var_type='c', bw='cv_ls')
    smooth_prices = pd.Series(data=model.fit([prices.index.values])[0], index=prices.index) # index also from 1

    # use the minima and maxima from the smoothed timeseries
    # to identify true local minima and maxima in the original timeseres
    # by taking the maximum/minimum price within a t-1, t+1 window in the smoothed timeseries
    smooth_prices_max_indices = argrelextrema(smooth_prices.values, np.greater)[0]
    smooth_prices_min_indices = argrelextrema(smooth_prices.values, np.less)[0]

    price_max_indices = []
    for i in smooth_prices_max_indices:
        if 1 < i < len(prices)-1:
            price_max_indices.append(prices.iloc[i-2:i+2].idxmax())

    price_min_indices = []
    for i in smooth_prices_min_indices:
        if 1 < i < len(prices)-1:
            price_min_indices.append(prices.iloc[i-2:i+2].idxmin())

    price_max = prices.loc[price_max_indices]
    price_min = prices.loc[price_min_indices]
    max_min = pd.concat([price_max, price_min]).sort_index()
    max_min = max_min[~max_min.duplicated()] # deduplicate points that are both maximum and minimum
    max_min

    return smooth_prices, smooth_prices_max_indices, smooth_prices_min_indices, \
            price_max_indices, price_min_indices, max_min
用一種算法來識別基于平滑價格數據的價格曲線改變方向的點,代碼在這個平滑的時間序列中搜索相對最大值和最小值。代碼試圖在平滑數據中找到這些極值后,將這些極值映射回原始的非平滑價格數據。
它通過檢查平滑數據中每個極值點周圍的小窗口來實現這一點,并確定該窗口內的價格最高或最低-這些是真正的局部最大值和最小值。在平滑和窗口化處理完成之后,代碼將這些點組織到一個內聚輸出中,刪除可能同時存在于最大值和最小值的任何重復點。
可以使用這個結果來確定交易的進入和退出點。除了在代碼中使用外,該代碼還可以用于更大的策略中,根據這些發現觸發買入或賣出信號。
smooth_prices, smooth_prices_max_indices, smooth_prices_min_indices, \
            price_max_indices, price_min_indices, max_min = find_max_min(prices
smooth_prices包含平滑版本的價格數據,可以消除噪音,使趨勢更容易識別。
有各種各樣的技術可用于平滑,包括移動平均線和其他算法。變量smooth_prices_max_indices和smooth_prices_min_indices可能表示平滑價格指數在局部最大值和最小值列表中的位置。當價格達到這些水平時,在價格反轉之前識別潛在的買入或賣出信號是至關重要的。與前面的變量一樣,price_max_indices和price_min_indices是從原始的、未平滑的價格中計算出來的。
max_min可能是一個數組或列表,其中包含有關已識別的最大值和最小值的信息,可能結合平滑和非平滑數據,用于根據本地價格極值確定是否進入或退出頭寸。可以分析金融價格數據,識別峰值和低谷,并準備數據用于算法交易。作為更大的技術分析系統的一部分,它可以用于基于歷史價格模式的自動交易活動。
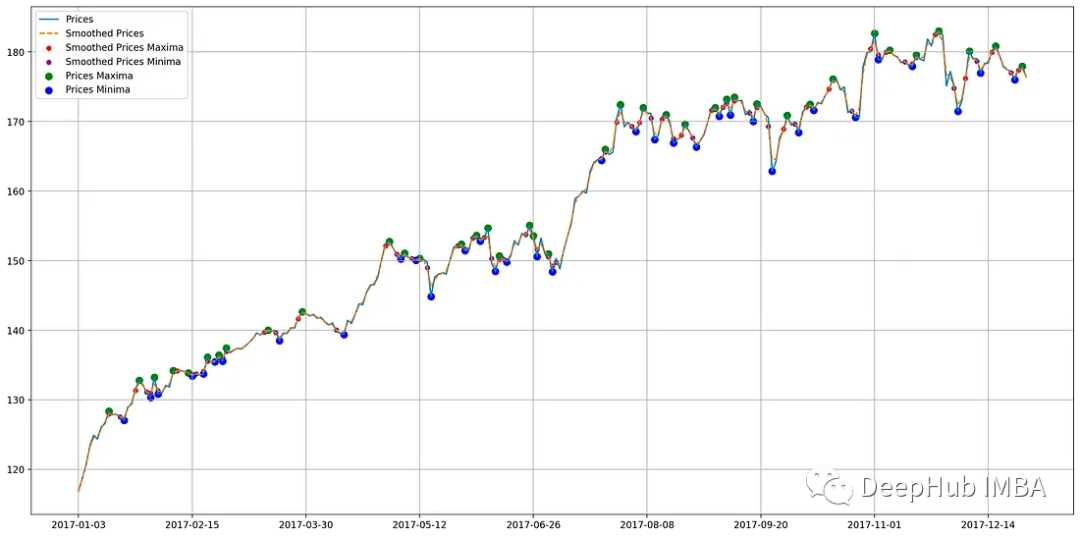
下面我們看看上面代碼計算得到的結果:
fig, ax = plt.subplots(figsize=(20,10), dpi=200)

 ax.plot(dates, prices, label='Prices')
 ax.plot(dates, smooth_prices, label='Smoothed Prices', linestyle='dashed')
 ax.set_xticks(np.arange(0, len(dates), 30))

 smooth_prices_max = smooth_prices.loc[smooth_prices_max_indices]
 smooth_prices_min = smooth_prices.loc[smooth_prices_min_indices]
 price_max = prices.loc[price_max_indices]
 price_min = prices.loc[price_min_indices]

 ax.scatter(dates.loc[smooth_prices_max.index], smooth_prices_max.values, s=20, color='red', label='Smoothed Prices Maxima')
 ax.scatter(dates.loc[smooth_prices_min.index], smooth_prices_min.values, s=20, color='purple', label='Smoothed Prices Minima')

 ax.scatter(dates.loc[price_max.index], price_max.values, s=50, color='green', label='Prices Maxima')
 ax.scatter(dates.loc[price_min.index], price_min.values, s=50, color='blue', label='Prices Minima')
 ax.legend(loc='upper left')
 ax.grid()
代碼繪制了具有不同線條風格的實際價格和平滑價格。該圖還顯示了實際和平滑價格數據中局部最大值和最小值的位置,可能識別交易進入和退出信號。
為了區分最大值和最小值,使用較大的符號和不同的顏色。時間軸每隔一段時間顯示在x軸上,以使其更清晰。圖表的圖例解釋了情節元素,網格有助于分析價格隨時間的變化,這些都是在繪圖中必不可少的工作。
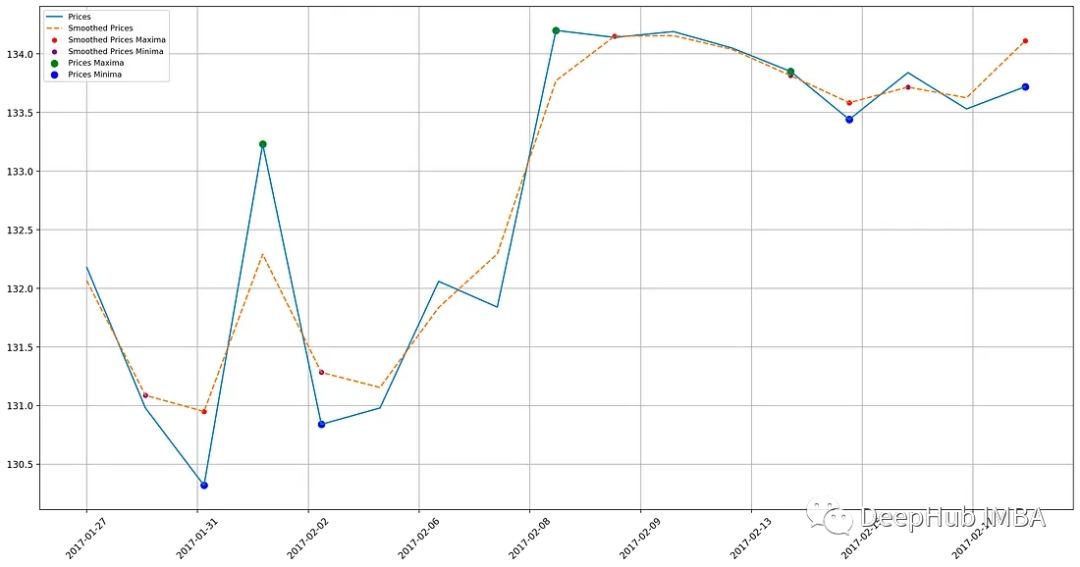
下面一個函數是Plot_window,它生成一個折線圖,顯示實際價格和平滑價格隨時間的變化。平滑可能有助于識別趨勢并過濾掉噪聲。在這張圖上可以區分出幾個關鍵點。顏色和大小用于識別實際和平滑價格曲線的局部最大值和最小高點和低點。交易策略通常關注這些關鍵點,因為它們可能預示著趨勢的逆轉或繼續。
def plot_window(dates, prices, smooth_prices,
                smooth_prices_max_indices, smooth_prices_min_indices,
                price_max_indices, price_min_indices,
                start, end, ax=None):
    if ax is None: fig, ax = plt.subplots(figsize=(20,10), dpi=200)

    ax.plot(dates.loc[start:end], prices.loc[start:end], label='Prices')
    ax.plot(dates.loc[start:end], smooth_prices.loc[start:end], label='Smoothed Prices', linestyle='dashed')
    ax.set_xticks(np.linspace(0, len(dates.loc[start:end]), 10))
    ax.tick_params(axis='x', rotatinotallow=45)

    smooth_prices_max = smooth_prices.loc[smooth_prices_max_indices].loc[start:end]
    smooth_prices_min = smooth_prices.loc[smooth_prices_min_indices].loc[start:end]
    price_max = prices.loc[price_max_indices].loc[start:end]
    price_min = prices.loc[price_min_indices].loc[start:end]

    ax.scatter(dates.loc[smooth_prices_max.index], smooth_prices_max.values, s=20, color='red', label='Smoothed Prices Maxima')
    ax.scatter(dates.loc[smooth_prices_min.index], smooth_prices_min.values, s=20, color='purple', label='Smoothed Prices Minima')

    ax.scatter(dates.loc[price_max.index], price_max.values, s=50, color='green', label='Prices Maxima')
    ax.scatter(dates.loc[price_min.index], price_min.values, s=50, color='blue', label='Prices Minima')
    ax.legend(fnotallow='small')
    ax.grid()
可以在較大的數據集中指定一個從開始到結束的時間窗口,這樣可以查看數據的子集。為了清晰起見,在x軸上顯示日期的同時還顯示了一個圖例和一個網格。
plot_window(dates, prices, smooth_prices,
            smooth_prices_max_indices, smooth_prices_min_indices,
            price_max_indices, price_min_indices,
            start=18, end=34, ax=None)
下面我們可以尋找一些簡單的模式:
def find_patterns(max_min):
    patterns = defaultdict(list)

    for i in range(5, len(max_min)):
        window = max_min.iloc[i-5:i]

        # pattern must play out in less than 36 days
        if window.index[-1] - window.index[0] > 35:
            continue

        # Using the notation from the paper to avoid mistakes
        e1, e2, e3, e4, e5 = window.iloc[:5]
        rtop_g1 = np.mean([e1, e3, e5])
        rtop_g2 = np.mean([e2, e4])

        # Head and Shoulders
        if (e1 > e2) and (e3 > e1) and (e3 > e5) and \
            (abs(e1 - e5) <= 0.03*np.mean([e1,e5])) and \
            (abs(e2 - e4) <= 0.03*np.mean([e1,e5])):
                patterns['HS'].append((window.index[0], window.index[-1]))

        # Inverse Head and Shoulders
        elif (e1 < e2) and (e3 < e1) and (e3 < e5) and \
            (abs(e1 - e5) <= 0.03*np.mean([e1,e5])) and \
            (abs(e2 - e4) <= 0.03*np.mean([e1,e5])):
                patterns['IHS'].append((window.index[0], window.index[-1]))

        # Broadening Top
        elif (e1 > e2) and (e1 < e3) and (e3 < e5) and (e2 > e4):
            patterns['BTOP'].append((window.index[0], window.index[-1]))

        # Broadening Bottom
        elif (e1 < e2) and (e1 > e3) and (e3 > e5) and (e2 < e4):
            patterns['BBOT'].append((window.index[0], window.index[-1]))

        # Triangle Top
        elif (e1 > e2) and (e1 > e3) and (e3 > e5) and (e2 < e4):
            patterns['TTOP'].append((window.index[0], window.index[-1]))

        # Triangle Bottom
        elif (e1 < e2) and (e1 < e3) and (e3 < e5) and (e2 > e4):
            patterns['TBOT'].append((window.index[0], window.index[-1]))

        # Rectangle Top
        elif (e1 > e2) and (abs(e1-rtop_g1)/rtop_g1 < 0.0075) and \
            (abs(e3-rtop_g1)/rtop_g1 < 0.0075) and (abs(e5-rtop_g1)/rtop_g1 < 0.0075) and \
            (abs(e2-rtop_g2)/rtop_g2 < 0.0075) and (abs(e4-rtop_g2)/rtop_g2 < 0.0075) and \
            (min(e1, e3, e5) > max(e2, e4)):
            patterns['RTOP'].append((window.index[0], window.index[-1]))

        # Rectangle Bottom
        elif (e1 < e2) and (abs(e1-rtop_g1)/rtop_g1 < 0.0075) and \
            (abs(e3-rtop_g1)/rtop_g1 < 0.0075) and (abs(e5-rtop_g1)/rtop_g1 < 0.0075) and \
            (abs(e2-rtop_g2)/rtop_g2 < 0.0075) and (abs(e4-rtop_g2)/rtop_g2 < 0.0075) and \
            (max(e1, e3, e5) > min(e2, e4)):
            patterns['RBOT'].append((window.index[0], window.index[-1]))

    return patterns
迭代DataFrame中的條目,同時考慮5個數據點。確定每個5點窗口的模式是否在36天內發生。如果沒有,則進入到下一個窗口。我們這里有幾種類型的技術分析圖表模式:
Head and Shoulders(頭肩頂):
這是一種反轉圖表模式,通常表示股價在漲勢中即將反轉。它包括一個中間峰(頭)和兩個較低的峰(肩),形成一個上升趨勢的結束信號。
Inverse Head and Shoulders(倒頭肩底):
與頭肩頂相反,這是一種底部反轉圖表模式。它包括一個中間洼地(倒頭)和兩個較低的洼地(倒肩),形成一個下降趨勢的結束信號。
Broadening Top(擴頂形態):
這是一種表示不穩定市場的圖表模式,由兩個趨勢線分散開來形成。它可能表示市場波動性增加,預示價格的不確定性。
Broadening Bottom(擴底形態):
與擴頂形態相反,這是一種表示不穩定市場的圖表模式,由兩個趨勢線逐漸匯聚。它可能表示市場波動性增加,預示價格的不確定性。
Triangle Top(三角形頂部):
這是一種形成在上升趨勢中的圖表模式,由兩個趨勢線收斂形成三角形。它可能表示價格即將下降。
Triangle Bottom(三角形底部):
與三角形頂部相反,這是一種形成在下降趨勢中的圖表模式,由兩個趨勢線收斂形成三角形。它可能表示價格即將上升。
Rectangle Top(矩形頂部):
這是一種在上升趨勢中形成的圖表模式,由水平線形成一個矩形。它表示市場可能經歷一段橫盤整理,價格可能會下跌。
Rectangle Bottom(矩形底部):
與矩形頂部相反,這是一種在下降趨勢中形成的圖表模式,由水平線形成一個矩形。它表示市場可能經歷一段橫盤整理,價格可能會上升。
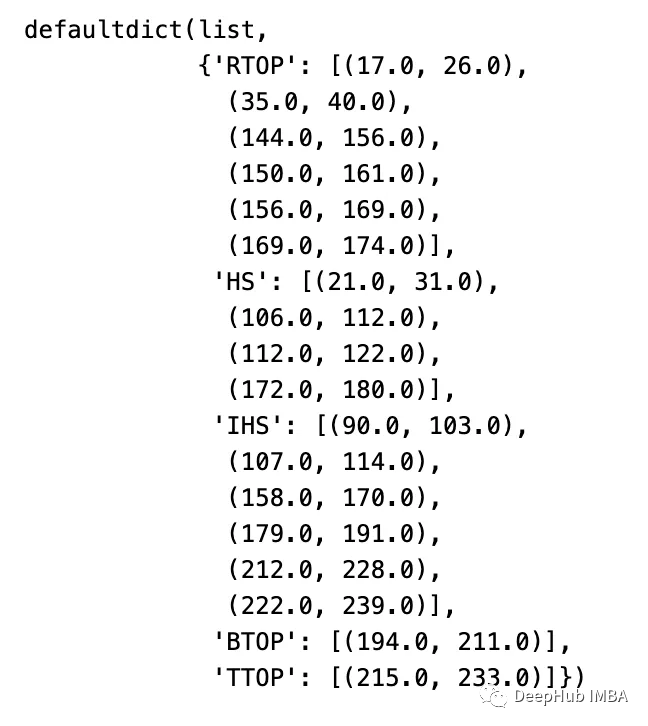
上面的這些模式是根據這些局部最大值和最小值的相對位置和值來識別的,檢測到的每個模式都存儲在一個字典中,模式名稱作為鍵,窗口的開始和結束索引作為值。這些索引元組存儲在每個模式末尾的字典中。
這樣的代碼在算法交易中很有用,當它自動檢測與某些市場行為相關的歷史模式時,允許交易者根據這些模式的存在做出明智的決策。
patterns = find_patterns(max_min)
 patterns
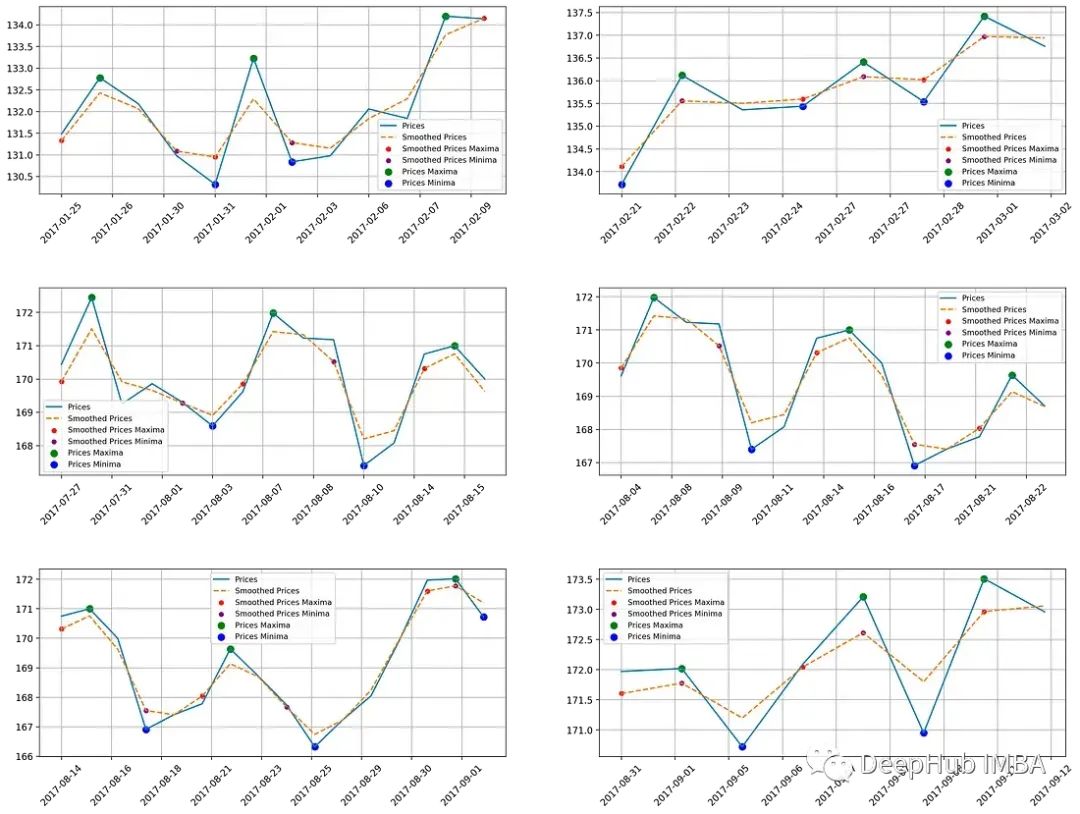
上面這些專有名字可能不太容易理解,所以我們可以使用代碼把它們進行可視化
def visualize_patterns(dates, prices, smooth_prices,
                        smooth_prices_max_indices, smooth_prices_min_indices,
                        price_max_indices, price_min_indices,
                        patterns, shorthand_fullname_dict):
    for name, end_day_nums in patterns.items():
        print('Pattern Identified: {} \nNumber of Observations: {}'.format(shorthand_fullname_dict[name], len(end_day_nums)))
        rows = int(np.ceil(len(end_day_nums)/2))
        fig, axes = plt.subplots(rows, 2, figsize=(20,5*rows), dpi=200)
        fig.subplots_adjust(hspace=0.5)
        axes = axes.flatten()
        i = 0
        for start_date, end_date in end_day_nums:
            plot_window(dates, prices, smooth_prices,
                smooth_prices_max_indices, smooth_prices_min_indices,
                price_max_indices, price_min_indices,
                start=start_date-1, end=end_date+1, ax=axes[i])
            i += 1
        plt.show()
 visualize_patterns(dates, prices, smooth_prices,
                        smooth_prices_max_indices, smooth_prices_min_indices,
                        price_max_indices, price_min_indices,
                        patterns, shorthand_fullname_dict)
可以看到各種模式是不一樣的,這對我們這些剛入門金融行業的人來說更容易理解。通過圖形化分析股票價格走勢和算法識別模式的工具,可以有助于我們更直觀地理解市場行為隨著時間的推移,這對算法交易至關重要。


