LLM代理應用實戰:構建Plotly數據可視化代理
如果你嘗試過像ChatGPT這樣的LLM,就會知道它們幾乎可以為任何語言或包生成代碼。但是僅僅依靠LLM是有局限的。對于數據可視化的問題我們需要提供一下的內容。

描述數據:模型本身并不知道數據集的細節,比如列名和行細節。手動提供這些信息可能很麻煩,特別是當數據集變得更大時。如果沒有這個上下文,LLM可能會產生幻覺或虛構列名,從而導致數據可視化中的錯誤。
樣式和偏好:數據可視化是一種藝術形式,每個人都有獨特的審美偏好,這些偏好因圖表類型和信息而異。不斷地為每個可視化提供不同的風格和偏好是很麻煩的。而配備了風格信息的代理可以簡化這一過程,確保一致和個性化的視覺輸出。
如果每次于LLM進行交互都附帶這些內容會導致請求過于復雜,不利于用戶的輸入,所以這次我們構建一個數據可視化的代理,通過代理我們只需提供很少的信息就能夠讓LLM生成我們定制化的圖表。

可視化庫的選擇
在構建一個數據可視化的AI代理時,選擇合適的可視化工具是至關重要的。雖然存在多種工具可以用于數據可視化,但Plotly和Matplotlib是最為常用的兩種。為了構建一個既功能豐富又用戶友好的可視化界面,我們決定使用Plotly作為主要的可視化庫。
與Matplotlib相比,Plotly提供了更加豐富的交互性功能。它支持直接在Web瀏覽器中的動態渲染,使得用戶能夠通過縮放、平移、懸停來互動式地探索數據。這種高度的交互性是Plotly的一大優勢,尤其是在需要展示復雜數據集或進行深入數據分析的應用場景中。
雖然Matplotlib在科學研究和學術出版物中有廣泛的應用,特別是在生成高質量的靜態圖像方面具有極高的靈活性和精確度,但其在交互性和Web集成方面的限制使得它在構建現代、交互式的數據可視化解決方案時可能不如Plotly那么吸引人。
所以我們選擇Plotly作為構建數據可視化AI代理的工具,不僅能夠滿足用戶對交互性的需求,還能夠提供強大的數據處理能力和優秀的用戶體驗。這將極大地提高數據可視化的效率和效果,使得數據分析更加直觀和易于理解。
下面是我使用Llama3 70B構建可視化基線。

我們執行上面的代碼將得到如下的結果

要構建這個應用程序,我們需要為LLM代理配備兩個工具:一個工具提供關于數據集的信息,另一個工具包含關于樣式的信息。
代理提供的信息
1、DataFrame信息
這個工具目的是分析DataFrame并將其內容信息存儲到索引中。要索引的數據包括列名、數據類型以及值的最小值、最大值和平均值范圍。這有助于代理理解它們正在處理的變量類型。
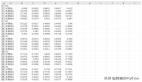
這里我們使用layoff.fyi 的數據來進行分析。

我們這里還做了一些預處理的工作,包括將數據轉換為適當的類型(例如,將數字字符串轉換為整數或浮點數)并刪除空值。
#Optional pre-processing
 import pandas as pd
 import numpy as np


 df = pd.read_csv('WARN Notices California_Omer Arain - Sheet1.csv')

 #Changes date like column into datetime
 df['Received Date'] = [pd.to_datetime(x) for x in df['Received Date']]
 df['Effective Date'] = [pd.to_datetime(x) for x in df['Effective Date']]
 #Converts numbers stored as strings into ints
 df['Number of Workers'] = [int(str(x).replace(',','')) if str(x)!='nan' else np.nan for x in df['Number of Workers']]
 # Replacing NULL values
 df = df.replace(np.nan,0)
將數據集信息存儲到索引中
from llama_index.core.readers.json import JSONReader
 from llama_index.core import VectorStoreIndex
 import json

 # Function that stores the max,min & mean for numerical values
 def return_vals(df,c):
    if isinstance(df[c].iloc[0], (int, float, complex)):
        return [max(df[c]), min(df[c]), np.mean(df[c])]
 # For datetime we need to store that information as string
    elif(isinstance(df[c].iloc[0],datetime.datetime)):
        return [str(max(df[c])), str(min(df[c])), str(np.mean(df[c]))]
    else:
 # For categorical variables you can store the top 10 most frequent items and their frequency
        return list(df[c].value_counts()[:10])

 # declare a dictionary
 dict_ = {}
 for c in df.columns:
 # storing the column name, data type and content
  dict_[c] = {'column_name':c,'type':str(type(df[c].iloc[0])), 'variable_information':return_vals(df,c)}
 # After looping storing the information as a json dump that can be loaded
 # into a llama-index Document

 # Writing the information into dataframe.json

 with open("dataframe.json", "w") as fp:
    json.dump(dict_ ,fp)


 reader = JSONReader()
 # Load data from JSON file
 documents = reader.load_data(input_file='dataframe.json')

 # Creating an Index
 dataframe_index = VectorStoreIndex.from_documents(documents)
這樣第一步就完成了。
2、自定義樣式信息
表樣式主要包括關于如何在plot中設置不同圖表樣式的自然語言說明。這里需要使用自然語言描述樣式,所以可能需要進行嘗試,下面是我如何創建折線圖和條形圖的說明!
from llama_index.core import Document
 from llama_index.core import VectorStoreIndex

 styling_instructions =[Document(text="""
  Dont ignore any of these instructions.
        For a line chart always use plotly_white template, reduce x axes & y axes line to 0.2 & x & y grid width to 1.
        Always give a title and make bold using html tag axis label and try to use multiple colors if more than one line
        Annotate the min and max of the line
        Display numbers in thousand(K) or Million(M) if larger than 1000/100000
        Show percentages in 2 decimal points with '%' sign
        """
        )
        , Document(text="""
        Dont ignore any of these instructions.
        For a bar chart always use plotly_white template, reduce x axes & y axes line to 0.2 & x & y grid width to 1.
        Always give a title and make bold using html tag axis label and try to use multiple colors if more than one line
        Always display numbers in thousand(K) or Million(M) if larger than 1000/100000. Add annotations x values
        Annotate the values on the y variable
        If variable is a percentage show in 2 decimal points with '%' sign.
        """)


        # You should fill in instructions for other charts and play around with these instructions
        , Document(text=
          """ General chart instructions
        Do not ignore any of these instructions
          always use plotly_white template, reduce x & y axes line to 0.2 & x & y grid width to 1.
        Always give a title and make bold using html tag axis label
        Always display numbers in thousand(K) or Million(M) if larger than 1000/100000. Add annotations x values
        If variable is a percentage show in 2 decimal points with '%'""")
          ]
 # Creating an Index
 style_index = VectorStoreIndex.from_documents(styling_instructions)
或者直接將部分樣式的代碼作為示例輸入給模型,這樣對于固定的樣式是非常好的一個方式
構建AI代理
我們上面已經構建了2個索引:DataFrame信息(元數據),表格自定義樣式信息
下面就可以使用lama- index從索引構建查詢引擎并將其用作代理工具使用。

#All imports for this section
 from llama_index.core.agent import ReActAgent
 from llama_index.core.tools import QueryEngineTool
 from llama_index.core.tools import ToolMetadata
 from llama_index.llms.groq import Groq


 # Build query engines over your indexes
 # It makes sense to only retrieve one document per query
 # However, you may play around with this if you need multiple charts
 # Or have two or more dataframes with similar column names
 dataframe_engine = dataframe_index.as_query_engine(similarity_top_k=1)
 styling_engine = style_index.as_query_engine(similarity_top_k=1)

 # Builds the tools
 query_engine_tools = [
    QueryEngineTool(
        query_engine=dataframe_engine,
 # Provides the description which helps the agent decide which tool to use
        metadata=ToolMetadata(
            name="dataframe_index",
            descriptinotallow="Provides information about the data in the data frame. Only use column names in this tool",
        ),
 \
    ),
    QueryEngineTool(
 # Play around with the description to see if it leads to better results
        query_engine=styling_engine,
        metadata=ToolMetadata(
            name="Styling",
            descriptinotallow="Provides instructions on how to style your Plotly plots"
            "Use a detailed plain text question as input to the tool.",
        ),
    ),
 ]

 # I used open-source models via Groq but you can use OpenAI/Google/Mistral models as well
 llm = Groq(model="llama3-70b-8192", api_key="<your_api_key>")

 # initialize ReAct agent
 agent = ReActAgent.from_tools(query_engine_tools, llm=llm, verbose=True)
為了防止幻覺,我這里稍微調整了一下提示,這步不是必須的
這里是ReAct的默認提示

修改為:

from llama_index.core import PromptTemplate

 new_prompt_txt= """You are designed to help with building data visualizations in Plotly. You may do all sorts of analyses and actions using Python

 ## Tools

 You have access to a wide variety of tools. You are responsible for using the tools in any sequence you deem appropriate to complete the task at hand.
 This may require breaking the task into subtasks and using different tools to complete each subtask.

 You have access to the following tools, use these tools to find information about the data and styling:
 {tool_desc}


 ## Output Format

 Please answer in the same language as the question and use the following format:

 ```
 Thought: The current language of the user is: (user's language). I need to use a tool to help me answer the question.
 Action: tool name (one of {tool_names}) if using a tool.
 Action Input: the input to the tool, in a JSON format representing the kwargs (e.g. {{"input": "hello world", "num_beams": 5}})
 ```

 Please ALWAYS start with a Thought.

 Please use a valid JSON format for the Action Input. Do NOT do this {{'input': 'hello world', 'num_beams': 5}}.

 If this format is used, the user will respond in the following format:

 ```
 Observation: tool response
 ```

 You should keep repeating the above format till you have enough information to answer the question without using any more tools. At that point, you MUST respond in the one of the following two formats:

 ```
 Thought: I can answer without using any more tools. I'll use the user's language to answer
 Answer: [your answer here (In the same language as the user's question)]
 ```

 ```
 Thought: I cannot answer the question with the provided tools.
 Answer: [your answer here (In the same language as the user's question)]
 ```

 ## Current Conversation

 Below is the current conversation consisting of interleaving human and assistant messages."""

 # Adding the prompt text into PromptTemplate object
 new_prompt = PromptTemplate(new_prompt_txt)

 # Updating the prompt
 agent.update_prompts({'agent_worker:system_prompt':new_prompt})
可視化
現在讓就可以向我們構建的代理發起請求了
response = agent.chat("Give Plotly code for a line chart for Number of Workers get information from the dataframe about the correct column names and make sure to style the plot properly and also give a title")
從輸出中可以看到代理如何分解請求并最終使用Python代碼進行響應(可以直接構建輸出解析器或復制過去并運行)。
通過運行以代碼創建的圖表,將注釋、標簽/標題和軸格式與樣式信息完全一致。因為已經有了數據信息,所以我們直接提出要求就可以,不需要輸入任何的數據信息

在試一試其他的圖表,生成一個柱狀圖

結果如下:

總結
AI代理可以自動化從多個數據源收集、清洗和整合數據的過程。這意味著可以減少手動處理錯誤,提高數據處理速度,讓分析師有更多時間專注于解讀數據而不是處理數據。使用AI代理進行數據可視化能夠顯著提升數據分析的深度和廣度,同時提高效率和用戶體驗,幫助企業和組織更好地利用他們的數據資產。
我們這里只是做了第一步,如果要制作一套代理工具還需要很多步驟,比如可視化代碼的自動執行,優化提示和處理常見故障等等,如果你對這方面感興趣,可以留言,如果人多的話我們會在后續的文章中一一介紹。