Echarts 地圖如何點擊定位到自己的家鄉城市區縣
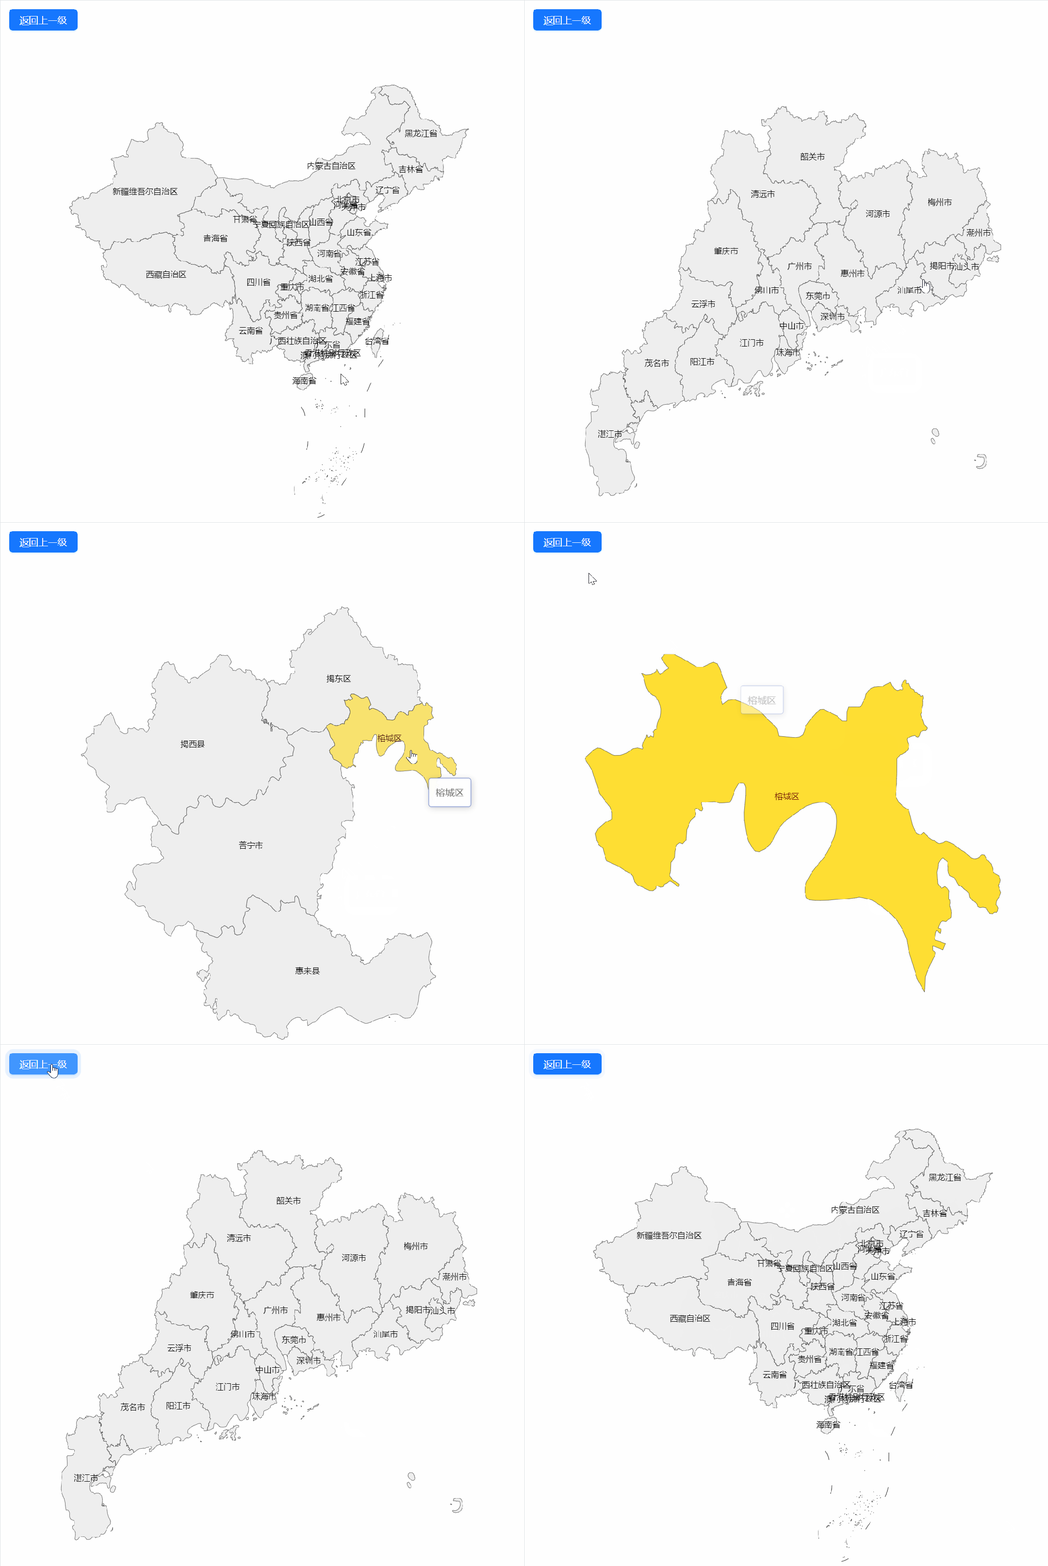
最近實現了通過Echarts地圖,定位到自己的家鄉,覺得挺有趣的,所以分享給大家,希望大家也可以實現一遍,在Echarts上定位到自己的家鄉看一看~
 圖片
圖片
地圖的繪制
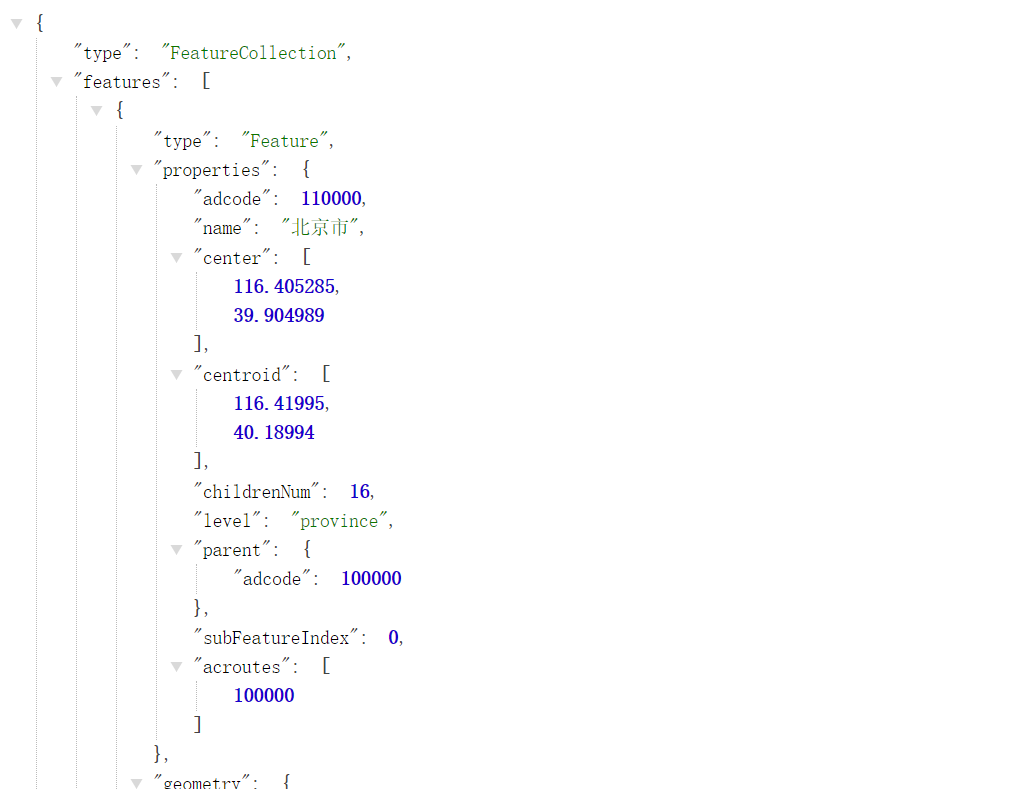
地圖數據
地圖的數據我們可以通過網上提供的 API 來進行獲取
API URL:https://geo.datav.aliyun.com/areas_v3/bound/{mapCode}.json
 圖片
圖片
繪制地圖
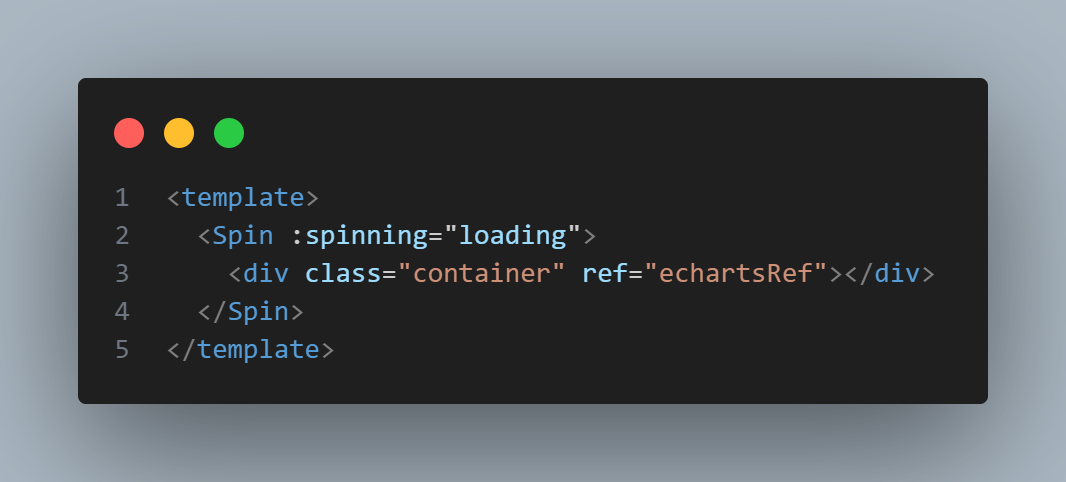
首先需要一個 DOM 節點來進行 Echarts 的繪制。
 圖片
圖片
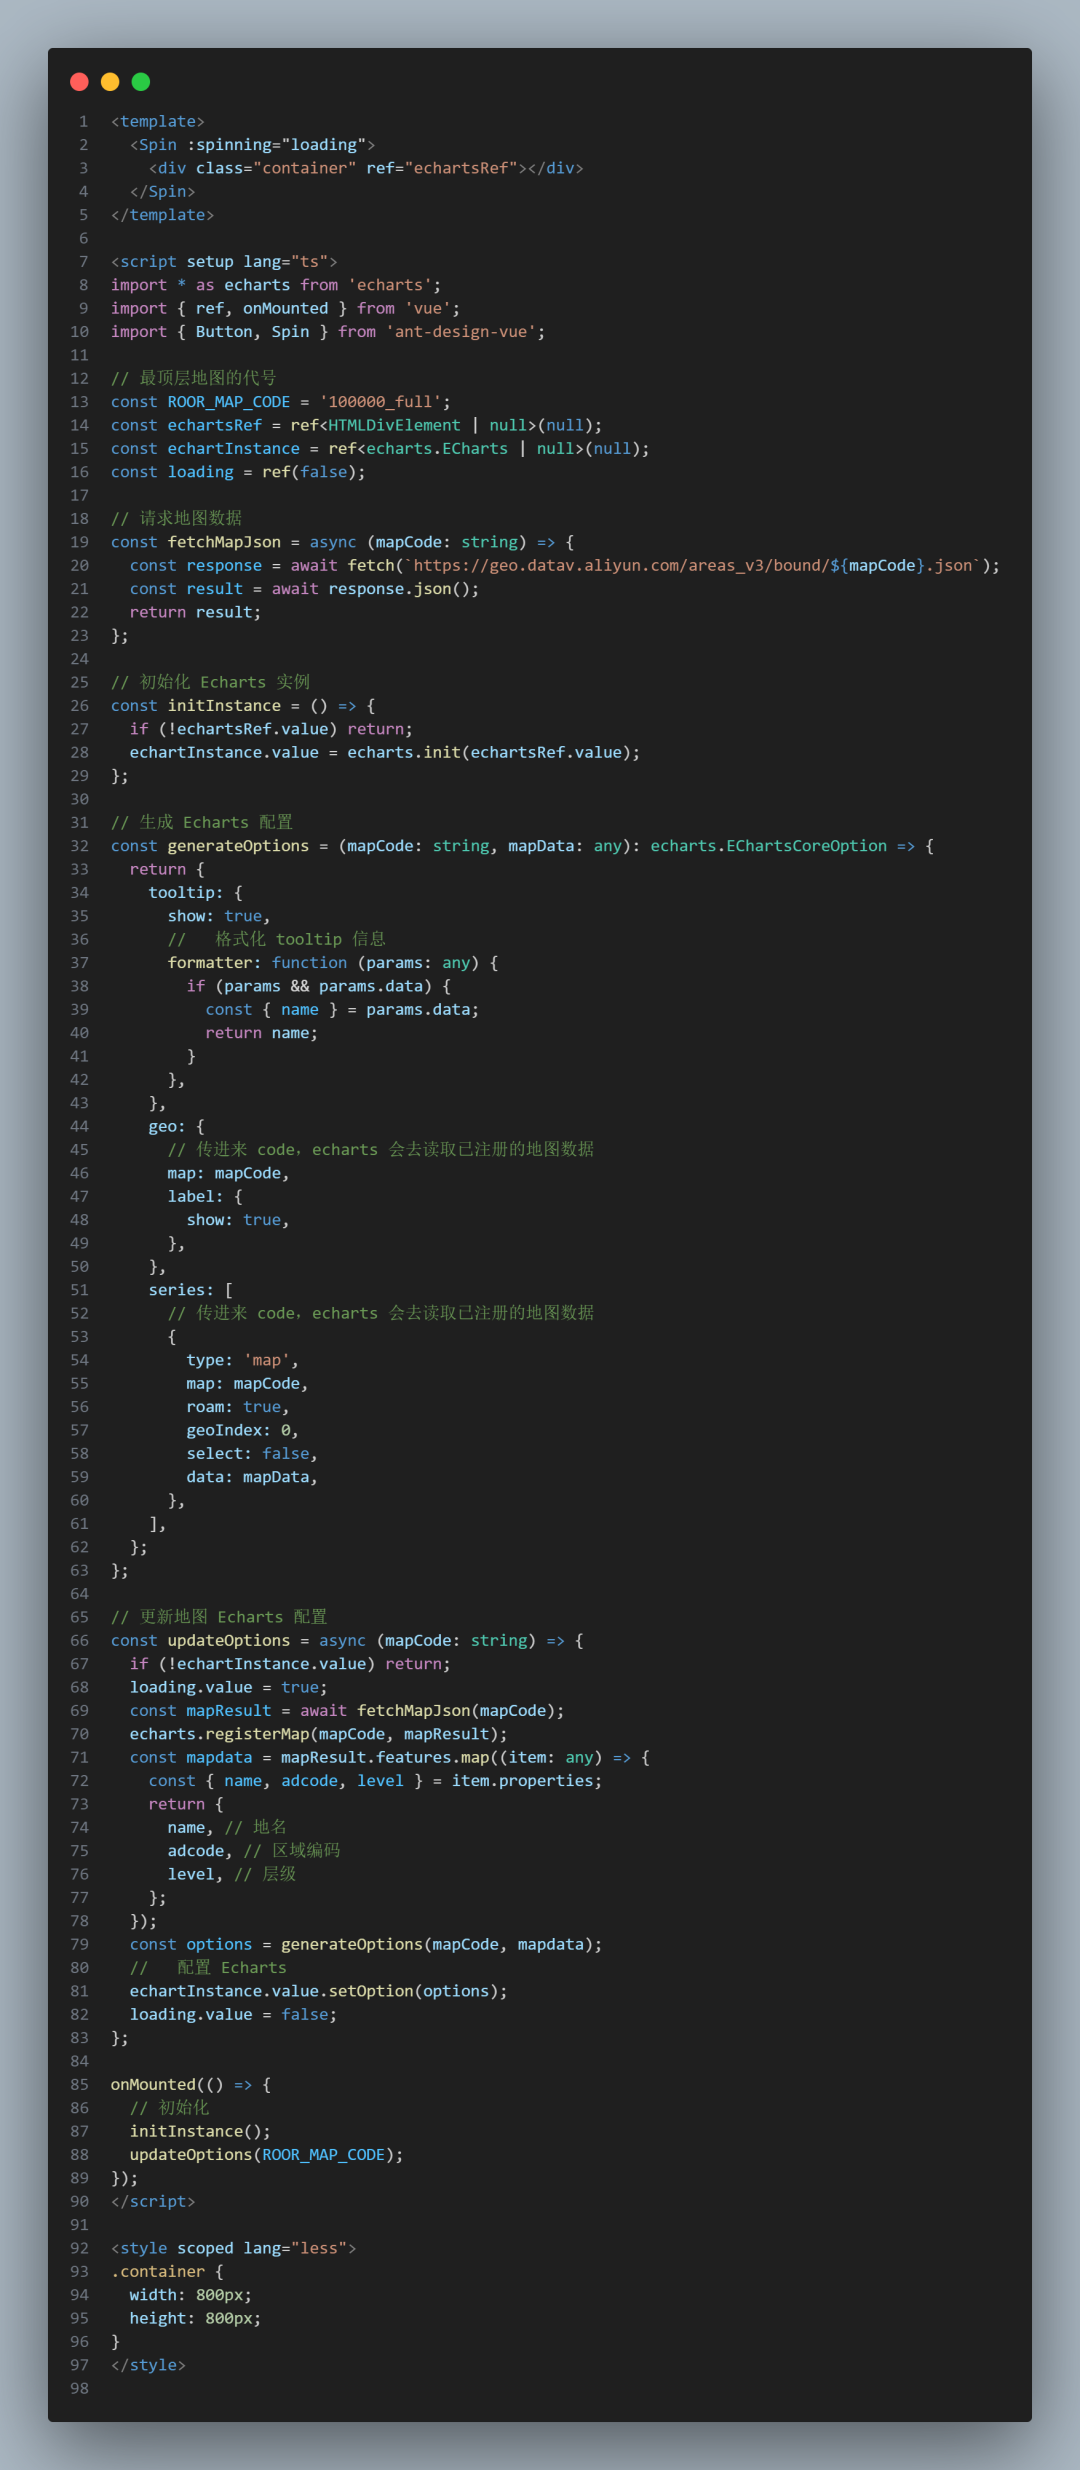
接著需要初始化 Echarts 實例,并進行配置,完成渲染。
 圖片
圖片
這樣就能把地圖渲染出來了。
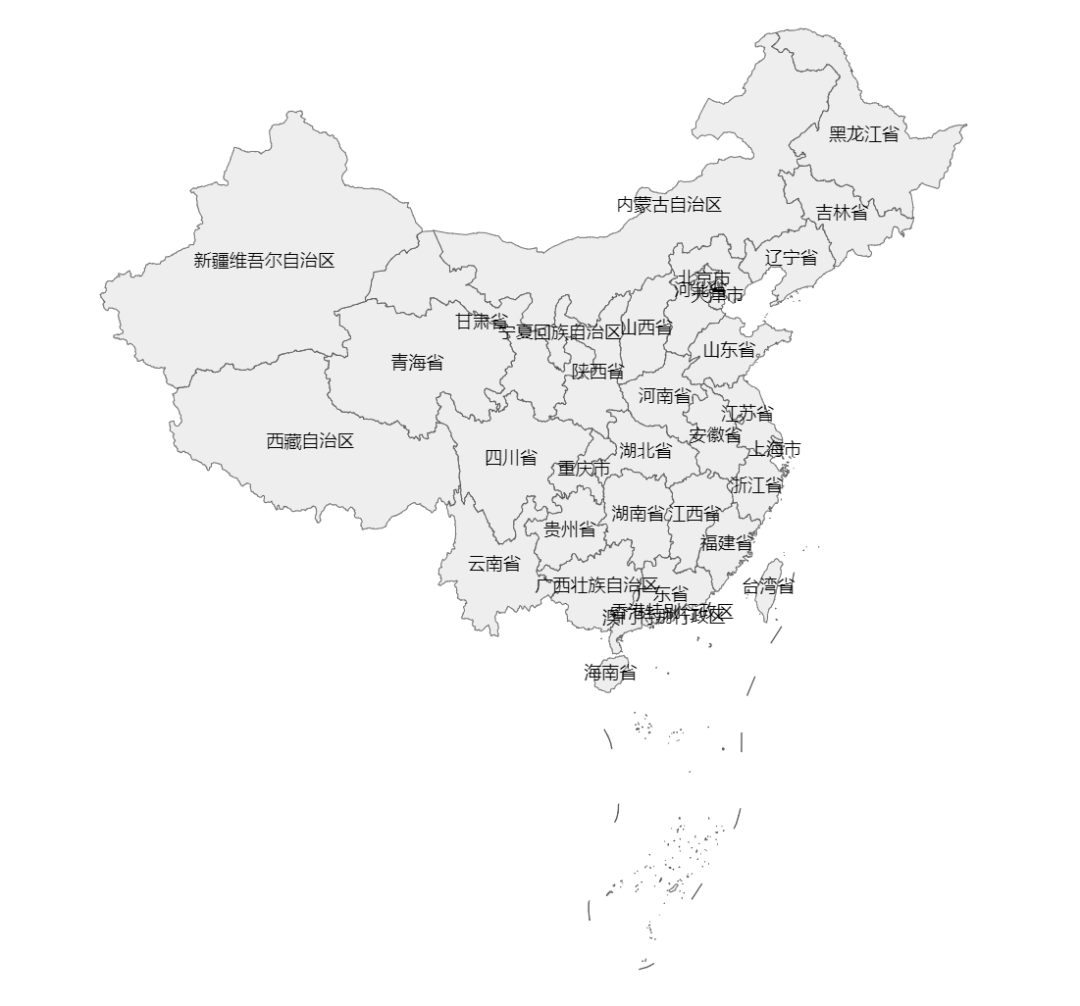 圖片
圖片
往下和往上定位
實現完整個地圖的渲染,我們還需要實現:
- 點擊某個地區,進行往下定位
- 點擊按鈕,進行往上定位
所以我們首先需要增加一個按鈕。
 圖片
圖片
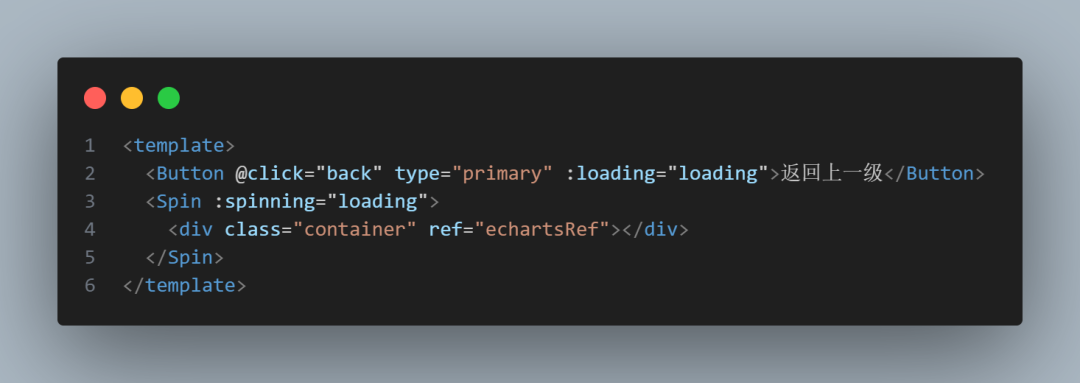
接著我們需要:
1、監聽 Echarts 的點擊事件。
2、獲取點擊的是哪個地區,進行數據獲取并渲染。
3、維護一個地區數組,記錄點擊的鏈路。
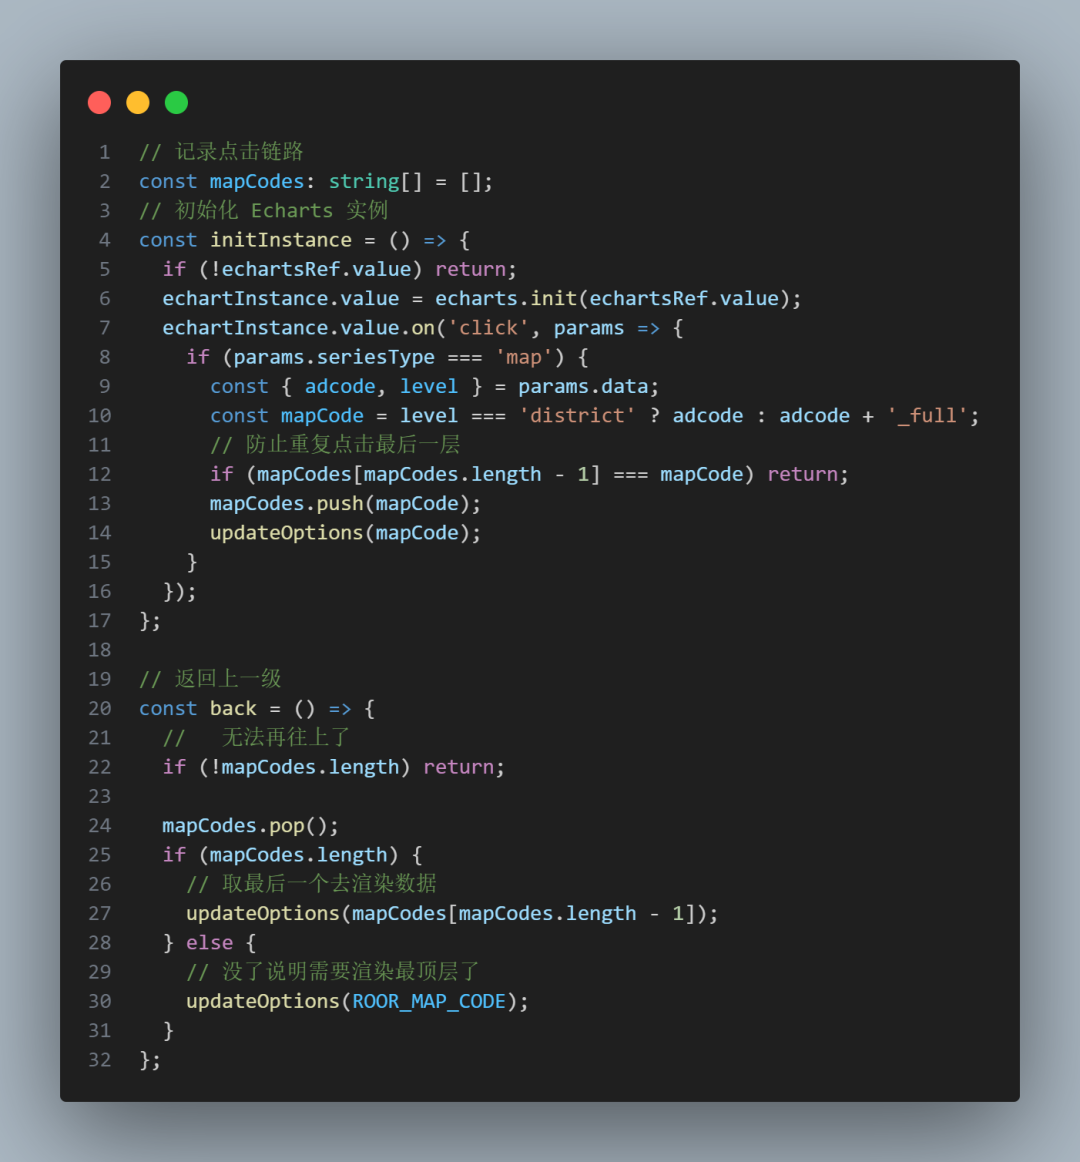 圖片
圖片
最終可以實現效果
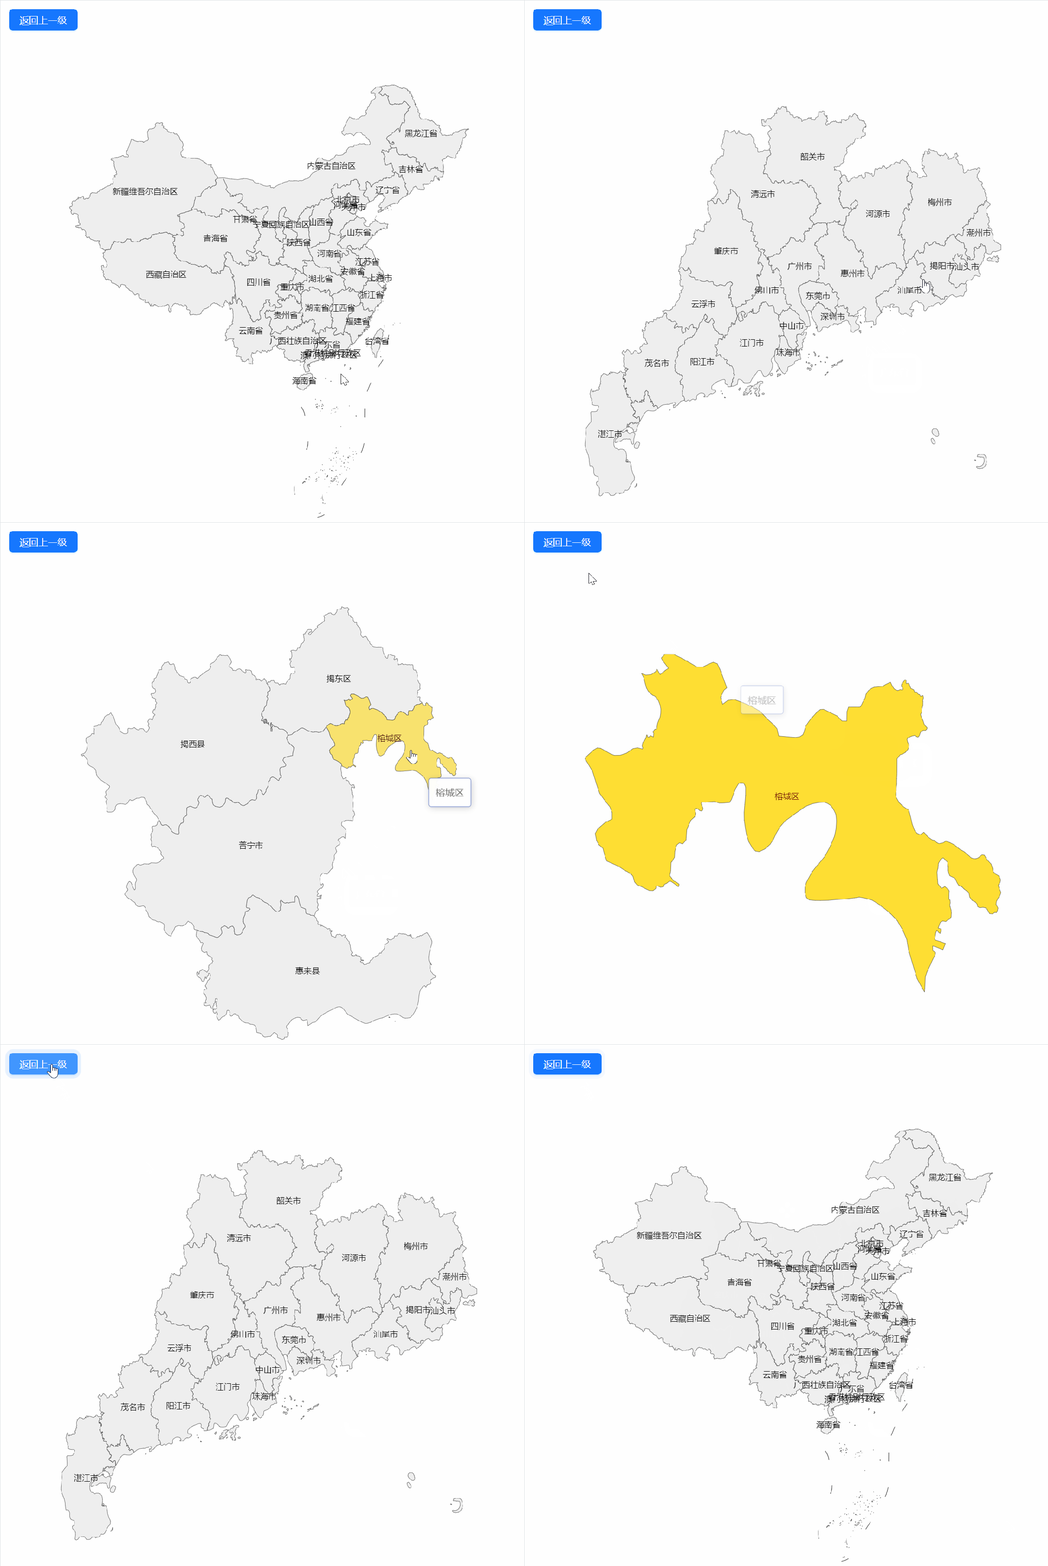 圖片
圖片
完整源碼
<template>
  <Button @click="back" type="primary" :loading="loading">返回上一級</Button>
  <Spin :spinning="loading">
    <div class="container" ref="echartsRef"></div>
  </Spin>
</template>

<script setup lang="ts">
import * as echarts from 'echarts';
import { ref, onMounted } from 'vue';
import { Button, Spin } from 'ant-design-vue';

// 最頂層地圖的代號
const ROOR_MAP_CODE = '100000_full';
const echartsRef = ref<HTMLDivElement | null>(null);
const echartInstance = ref<echarts.ECharts | null>(null);
const loading = ref(false);

// 請求地圖數據
const fetchMapJson = async (mapCode: string) => {
  const response = await fetch(`https://geo.datav.aliyun.com/areas_v3/bound/${mapCode}.json`);
  const result = await response.json();
  return result;
};

// 記錄點擊鏈路
const mapCodes: string[] = [];
// 初始化 Echarts 實例
const initInstance = () => {
  if (!echartsRef.value) return;
  echartInstance.value = echarts.init(echartsRef.value);
  echartInstance.value.on('click', params => {
    if (params.seriesType === 'map') {
      const { adcode, level } = params.data;
      const mapCode = level === 'district' ? adcode : adcode + '_full';
      // 防止重復點擊最后一層
      if (mapCodes[mapCodes.length - 1] === mapCode) return;
      mapCodes.push(mapCode);
      updateOptions(mapCode);
    }
  });
};

// 返回上一級
const back = () => {
  //   無法再往上了
  if (!mapCodes.length) return;

  mapCodes.pop();
  if (mapCodes.length) {
    // 取最后一個去渲染數據
    updateOptions(mapCodes[mapCodes.length - 1]);
  } else {
    // 沒了說明需要渲染最頂層了
    updateOptions(ROOR_MAP_CODE);
  }
};

// 生成 Echarts 配置
const generateOptions = (mapCode: string, mapData: any): echarts.EChartsCoreOption => {
  return {
    tooltip: {
      show: true,
      //   格式化 tooltip 信息
      formatter: function (params: any) {
        if (params && params.data) {
          const { name } = params.data;
          return name;
        }
      },
    },
    geo: {
      // 傳進來 code,echarts 會去讀取已注冊的地圖數據
      map: mapCode,
      label: {
        show: true,
      },
    },
    series: [
      // 傳進來 code,echarts 會去讀取已注冊的地圖數據
      {
        type: 'map',
        map: mapCode,
        roam: true,
        geoIndex: 0,
        select: false,
        data: mapData,
      },
    ],
  };
};

// 更新地圖 Echarts 配置
const updateOptions = async (mapCode: string) => {
  if (!echartInstance.value) return;
  loading.value = true;
  const mapResult = await fetchMapJson(mapCode);
  echarts.registerMap(mapCode, mapResult);
  const mapdata = mapResult.features.map((item: any) => {
    const { name, adcode, level } = item.properties;
    return {
      name, // 地名
      adcode, // 區域編碼
      level, // 層級
    };
  });
  const options = generateOptions(mapCode, mapdata);
  //   配置 Echarts
  echartInstance.value.setOption(options);
  loading.value = false;
};

onMounted(() => {
  // 初始化
  initInstance();
  updateOptions(ROOR_MAP_CODE);
});
</script>

<style scoped lang="less">
.container {
  width: 800px;
  height: 800px;
}
</style>


