像老大一樣優化Python
我們應該忘掉一些小的效率問題,在 97% 的情況下是這么說的:過早優化是萬惡之源。—— Donald Knuth
如果不首先想想這句Knuth的名言,就開始進行優化工作是不明智的。可是,你很快寫出來加入一些特性的代碼,可能會很丑陋,你需要注意了。這篇文章就是為這時候準備的。
那么接下來就是一些很有用的工具和模式來快速優化Python。它的主要目的很簡單:盡快發現瓶頸,修復它們并且確認你修復了它們。
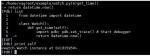
寫一個測試
在你開始優化前,寫一個高級測試來證明原來代碼很慢。你可能需要采用一些最小值數據集來復現它足夠慢。通常一兩個顯示運行時秒的程序就足夠處理一些改進的地方了。
有一些基礎測試來保證你的優化沒有改變原有代碼的行為也是很必要的。你也能夠在很多次運行測試來優化代碼的時候稍微修改這些測試的基準。
那么現在,我們來來看看優化工具把。
簡單的計時器
計時器很簡單,這是一個最靈活的記錄執行時間的方法。你可以把它放到任何地方并且副作用很小。運行你自己的計時器非常簡單,并且你可以將其定制,使它以你期望的方式工作。例如,你個簡單的計時器如下:
- import time
- def timefunc(f):
- def f_timer(*args, **kwargs):
- start = time.time()
- result = f(*args, **kwargs)
- end = time.time()
- print f.__name__, 'took', end - start, 'time'
- return result
- return f_timer
- def get_number():
- for x in xrange(5000000):
- yield x
- @timefunc
- def expensive_function():
- for x in get_number():
- i = x ^ x ^ x
- return 'some result!'
- # prints "expensive_function took 0.72583088875 seconds"
- result = expensive_function()
當然,你可以用上下文管理來讓它功能更加強大,添加一些檢查點或者一些其他的功能:
- import time
- class timewith():
- def __init__(self, name=''):
- self.name = name
- self.start = time.time()
- @property
- def elapsed(self):
- return time.time() - self.start
- def checkpoint(self, name=''):
- print '{timer} {checkpoint} took {elapsed} seconds'.format(
- timer=self.name,
- checkpoint=name,
- elapsed=self.elapsed,
- ).strip()
- def __enter__(self):
- return self
- def __exit__(self, type, value, traceback):
- self.checkpoint('finished')
- pass
- def get_number():
- for x in xrange(5000000):
- yield x
- def expensive_function():
- for x in get_number():
- i = x ^ x ^ x
- return 'some result!'
- # prints something like:
- # fancy thing done with something took 0.582462072372 seconds
- # fancy thing done with something else took 1.75355315208 seconds
- # fancy thing finished took 1.7535982132 seconds
- with timewith('fancy thing') as timer:
- expensive_function()
- timer.checkpoint('done with something')
- expensive_function()
- expensive_function()
- timer.checkpoint('done with something else')
- # or directly
- timer = timewith('fancy thing')
- expensive_function()
- timer.checkpoint('done with something')
計時器還需要你做一些挖掘。包裝一些更高級的函數,并且確定瓶頸在哪,然后深入的函數里,能夠不停的重現。當你發現一些不合適的代碼,修復它,然后測試一遍以確認它被修復了。
一些小技巧:不要忘了好用的timeit模塊!它對小塊代碼做基準測試而不是實際調查更加有用。
- Timer 優點:很容易理解和實現。也非常容易在修改后進行比較。對于很多語言都適用。
- Timer 缺點:有時候對于非常復雜的代碼有點過于簡單,你可能會花更多時間放置或移動引用代碼而不是修復問題!
#p#
內建優化器
啟用內建的優化器就像是用一門大炮。它非常強大,但是有點不太好用,使用和解釋起來比較復雜。
你可以了解更多關于profile模塊的東西,但是它的基礎是非常簡單的:你能夠啟用和禁用優化器,而且它能打印所有的函數調用和執行時間。它能給你編譯和打印出輸出。一個簡單的裝飾器如下:
- import cProfile
- def do_cprofile(func):
- def profiled_func(*args, **kwargs):
- profile = cProfile.Profile()
- try:
- profile.enable()
- result = func(*args, **kwargs)
- profile.disable()
- return result
- finally:
- profile.print_stats()
- return profiled_func
- def get_number():
- for x in xrange(5000000):
- yield x
- @do_cprofile
- def expensive_function():
- for x in get_number():
- i = x ^ x ^ x
- return 'some result!'
- # perform profiling
- result = expensive_function()
在上面代碼的情況下,你應該看到有些東西在終端打印出來,打印的內容如下:
- 5000003 function calls in 1.626 seconds
- Ordered by: standard name
- ncalls tottime percall cumtime percall filename:lineno(function)
- 5000001 0.571 0.000 0.571 0.000 timers.py:92(get_number)
- 1 1.055 1.055 1.626 1.626 timers.py:96(expensive_function)
- 1 0.000 0.000 0.000 0.000 {method 'disable' of '_lsprof.Profiler' objects}
你可以看到,它給出了不同函數的調用次數,但它遺漏了一些關鍵的信息:是哪個函數讓運行這么慢?
可是,這對于基礎優化來說是個好的開始。有時候甚至能用更少的精力找到解決方案。我經常用它來在深入挖掘究竟是哪個函數慢或者調用次數過多之前來調試程序。
- 內建優點:沒有額外的依賴并且非常快。對于快速的高等級檢查非常有用。
- 內建缺點:信息相對有限,需要進一步的調試;報告有點不太直接,尤其是對于復雜的代碼。
Line Profiler
如果內建的優化器是一門大炮,那么line profiler可以看作是一門離子加農炮。它非常的重量級和強大。
在這個例子里,我們會用非常棒的line_profiler庫。為了容易使用,我們會再次用裝飾器包裝一下,這種簡單的方法也可以防止把它放在生產代碼里。
- try:
- from line_profiler import LineProfiler
- def do_profile(follow=[]):
- def inner(func):
- def profiled_func(*args, **kwargs):
- try:
- profiler = LineProfiler()
- profiler.add_function(func)
- for f in follow:
- profiler.add_function(f)
- profiler.enable_by_count()
- return func(*args, **kwargs)
- finally:
- profiler.print_stats()
- return profiled_func
- return inner
- except ImportError:
- def do_profile(follow=[]):
- "Helpful if you accidentally leave in production!"
- def inner(func):
- def nothing(*args, **kwargs):
- return func(*args, **kwargs)
- return nothing
- return inner
- def get_number():
- for x in xrange(5000000):
- yield x
- @do_profile(follow=[get_number])
- def expensive_function():
- for x in get_number():
- i = x ^ x ^ x
- return 'some result!'
- result = expensive_function()
- 如果你運行上面的代碼,你就可以看到一下的報告:
- 1
- 2
- 3
- 4
- 5
- 6
- 7
- 8
- 9
- 10
- 11
- 12
- 13
- 14
- 15
- 16
- 17
- 18
- 19
- 20
- 21
- 22
- Timer unit: 1e-06 s
- File: test.py
- Function: get_number at line 43
- Total time: 4.44195 s
- Line # Hits Time Per Hit % Time Line Contents
- ==============================================================
- 43 def get_number():
- 44 5000001 2223313 0.4 50.1 for x in xrange(5000000):
- 45 5000000 2218638 0.4 49.9 yield x
- File: test.py
- Function: expensive_function at line 47
- Total time: 16.828 s
- Line # Hits Time Per Hit % Time Line Contents
- ==============================================================
- 47 def expensive_function():
- 48 5000001 14090530 2.8 83.7 for x in get_number():
- 49 5000000 2737480 0.5 16.3 i = x ^ x ^ x
- 50 1 0 0.0 0.0 return 'some result!'
你可以看到,有一個非常詳細的報告,能讓你完全洞悉代碼運行的情況。不想內建的cProfiler,它能計算話在語言核心特性的時間,比如循環和導入并且給出在不同的行花費的時間。
這些細節能讓我們更容易理解函數內部。如果你在研究某個第三方庫,你可以直接將其導入并加上裝飾器來分析它。
一些小技巧:只裝飾你的測試函數并將問題函數作為接下來的參數。
- Line Profiler 優點:有非常直接和詳細的報告。能夠追蹤第三方庫里的函數。
- Line Profiler 缺點:因為它會讓代碼比真正運行時慢很多,所以不要用它來做基準測試。這是額外的需求。
總結和最佳實踐
你應該用更簡單的工具來對測試用例進行根本的檢查,并且用更慢但能顯示更多細節的line_profiler來深入到函數內部。
九成情況下,你可能會發現在一個函數里循環調用或一個錯誤的數據結構消耗了90%的時間。一些調整工具是非常適合你的。
如果你仍然覺得這太慢,而是用一些你自己的秘密武器,如比較屬性訪問技術或調整平衡檢查技術。你也可以用如下的方法:
1.忍受緩慢或者緩存它們
2.重新思考整個實現
3.更多使用優化的數據結構
4.寫一個C擴展
注意了,優化代碼是種罪惡的快感!用合適的方法來為你的Python代碼加速很有意思,但是注意不要破壞了本身的邏輯。可讀的代碼比運行速度更重要。先把它緩存起來再進行優化其實更好。