Python爬取歷年高考分數線,幫你預測2018年高考分數線
粉絲獨白
高考已經結束了,相信絕大部分同學都在放松自己了,畢竟壓抑了這么久。現在雖然距離高考放榜還有一段時間,可能有一些同學已經迫不及待地想知道自己考的怎樣。因此,現在就來爬取高考網上的近幾年高考分數線,看一下近幾年分數線的變化趨勢,從而心里面有個底,這樣才能夠更加放松的去嗨皮。
使用的工具庫
- beautifulsoup
- mongodb
- echarts
1.總體思路
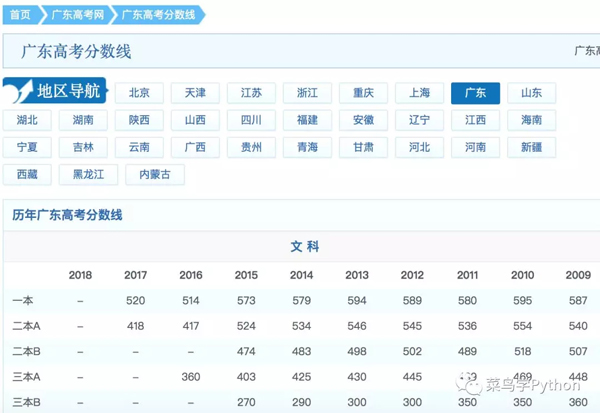
在高考網上,可以查看各省的分數線,其中文理科都有2009-2017年的數據,所以可以直接爬取這些數據下來存到MongoDB中,然后再使用echarts進行繪圖展示,從而可以更加直觀的看到高考分數線的變化趨勢。
2.爬取數據
(1)獲取各省的分數線信息
有兩種方法可以達到這個目的
1).通過拼接URL鏈接切換省份,可以得出鏈接的變化規律:只要替換省份的拼音上去就可以請求到:
http://www.gaokao.com/guangdong/fsx/
http://www.gaokao.com/shanghai/fsx/
推薦使用pypinyin模塊——漢字拼音轉換模塊/工具。直接使用lazy_pinyin方法就可以得到各省的拼音。由于返回的是列表,所以還需要處理一下才能使用。
- >>> from pypinyin import lazy_pinyin
- >>> lazy_pinyin('北京')
- ['bei', 'jing']
2).通過獲取地區導航中的各省鏈接,直接得到URL:
獲取各省份的鏈接:
- # 獲取省份及鏈接
- pro_link = []
- def get_provice(url):
- web_data = requests.get(url, headers=header)
- soup = BeautifulSoup(web_data.content, 'lxml')
- provice_link = soup.select('.area_box > a')
- for link in provice_link:
- href = link['href']
- provice = link.select('span')[0].text
- data = {
- 'href': href,
- 'provice': provice
- }
- provice_href.insert_one(data)#存入數據庫
- pro_link.append(href)
(2)爬取分數線
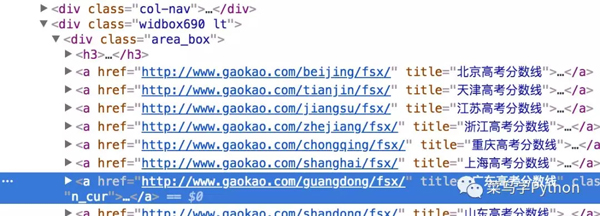
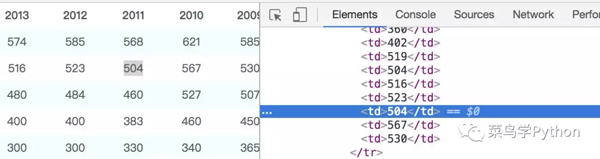
接下來就可以開始爬取分數線了,通過審查元素(如下圖),直接使用beautifulsoup來過濾內容。
- # 獲取分數線
- def get_score(url):
- web_data = requests.get(url, headers=header)
- soup = BeautifulSoup(web_data.content, 'lxml')
- # 獲取省份信息
- provice = soup.select('.col-nav span')[0].text[0:-5]
- # 獲取文理科
- categories = soup.select('h3.ft14')
- category_list = []
- for item in categories:
- category_list.append(item.text.strip().replace(' ', ''))#替換空格
- # 獲取分數
- tables = soup.select('h3 ~ table')
- for index, table in enumerate(tables):
- tr = table.find_all('tr', attrs={'class': re.compile('^c_\S*')})#使用正則匹配
- for j in tr:
- td = j.select('td')
- score_list = []
- for k in td:
- # 獲取每年的分數
- if 'class' not in k.attrs:
- score = k.text.strip()
- score_list.append(score)
- # 獲取分數線類別
- elif 'class' in k.attrs:
- score_line = k.text.strip()
- score_data = {
- 'provice': provice.strip(),#省份
- 'category': category_list[index],#文理科分類
- 'score_line': score_line,#分數線類別
- 'score_list': score_list#分數列表
- }
- score_detail.insert_one(score_data)#插入數據庫
3.開始爬取
由于有30多個省份,所以這里使用多線程來爬取,可以提高爬取效率。
- if __name__ == '__main__':
- header = {
- 'User-Agent': 'Mozilla/5.0 (Windows NT 10.0; Win64; x64; rv:58.0) Gecko/20100101 Firefox/58.0',
- 'Connection': 'keep - alive'
- }
- url = 'http://www.gaokao.com/guangdong/fsx/'
- get_provice(url)
- pool = Pool()
- pool.map(get_score, [i for i in pro_link])#使用多線程
使用多線程爬取的話,不用1分鐘就可以爬完所有的數據了。看,多線程可牛逼了,叉會腰先。
4.數據可視化
爬取數據只是***步,接下來就要對數據進行處理展示了。從mongodb 中查找出數據,對數據進行清洗整理,由于我這里的pyecharts有點問題,所以使用echarts進行展示。
1).篩選省份等信息
直接通過mongodb的find函數,限制查找的內容。
- import pymongo
- import charts
- client = pymongo.MongoClient('localhost', 27017)
- gaokao = client['gaokao']
- score_detail = gaokao['score_detail']
- # 篩選分數線、省份、文理科
- def get_score(line,pro,cate):
- score_list=[]
- for i in score_detail.find({"$and":[{"score_line":line},{"provice":pro},{'category': cate}]}):
- score_list = i['score_list']
- score_list.remove('-')#去掉沒有數據的欄目
- score_list = list(map(int, score_list))
- score_list.reverse()
- return score_list
2).定義相關數據
- # 獲取文理科分數
- line = '一本'
- pro = '北京'
- cate_wen = '文科'
- cate_li = '理科'
- wen=[]
- li = []
- wen=get_score(line,pro,cate_wen)#文科
- li=get_score(line,pro,cate_li)#理科
- # 定義年份
- year = [2017,2016,2015,2014,2013,2012,2011,2010,2009]
- year.reverse()
3).折線圖展示
- series = [
- {
- 'name': '文 科',
- 'data': wen,
- 'type': 'line'
- }, {
- 'name': '理科',
- 'data': li,
- 'type': 'line',
- 'color':'#ff0066'
- }
- ]
- options = {
- 'chart' : {'zoomType':'xy'},
- 'title' : {'text': '{}省{}分數線'.format(pro,line)},
- 'subtitle': {'text': 'Source: gaokao.com'},
- 'xAxis' : {'categories': year},
- 'yAxis' : {'title': {'text': 'score'}}
- }
- charts.plot(series, options=options,show='inline')
這樣就可以得到下面的歷年分數線趨勢圖了。當然,可以修改get_score的參數就可以的到其他省份的信息了。
5.預測分數線
通過折線圖,可以大概的預測2018年北京高考一本的分數線:文科在550-560分之間;理科在530-540分之間。當然,這只是預測的,如果有特殊情況的話,可能波動會比較大。另外,還可以通過拉格朗日插值法求出今年的分數線,這樣比較準確,但是由于過程比較麻煩,所以這里只是目測而已。