用R語言分析與預測員工離職
在實驗室搬磚之后,繼續我們的kaggle數據分析之旅,這次數據也是答主在kaggle上選擇的比較火的一份關于人力資源的數據集,關注點在于員工離職的分析和預測,依然還是從數據讀取,數據預處理,EDA和機器學習建模這幾個部分開始進行,***使用集成學習中比較火的random forest算法來預測離職情況。
數據讀取
- setwd("E:/kaggle/human resource")
- library(data.table)
- library(plotly)
- library(corrplot)
- library(randomForest)
- library(pROC)
- library(tidyverse)
- library(caret)
- hr<-as.tibble(fread("HR_comma_sep.csv"))
- glimpse(hr)
- sapply(hr,function(x){sum(is.na(x))})
- ————————————————————————————————————————————————————————————————————————————————————
- Observations: 14,999
- Variables: 10
- $ satisfaction_level <dbl> 0.38, 0.80, 0.11, 0.72, 0.37, 0.41, 0.10, 0.92, 0.89, 0.42, 0.45, 0.11, 0.84, 0.41, 0.36, 0.38, 0.45, 0.78, 0.45, 0.76, 0.11, 0.3...
- $ last_evaluation <dbl> 0.53, 0.86, 0.88, 0.87, 0.52, 0.50, 0.77, 0.85, 1.00, 0.53, 0.54, 0.81, 0.92, 0.55, 0.56, 0.54, 0.47, 0.99, 0.51, 0.89, 0.83, 0.5...
- $ number_project <int> 2, 5, 7, 5, 2, 2, 6, 5, 5, 2, 2, 6, 4, 2, 2, 2, 2, 4, 2, 5, 6, 2, 6, 2, 2, 5, 4, 2, 2, 2, 6, 2, 2, 2, 4, 6, 2, 2, 6, 2, 5, 2, 2, ...
- $ average_montly_hours <int> 157, 262, 272, 223, 159, 153, 247, 259, 224, 142, 135, 305, 234, 148, 137, 143, 160, 255, 160, 262, 282, 147, 304, 139, 158, 242,...
- $ time_spend_company <int> 3, 6, 4, 5, 3, 3, 4, 5, 5, 3, 3, 4, 5, 3, 3, 3, 3, 6, 3, 5, 4, 3, 4, 3, 3, 5, 5, 3, 3, 3, 4, 3, 3, 3, 6, 4, 3, 3, 4, 3, 5, 3, 3, ...
- $ Work_accident <int> 0, 0, 0, 0, 0, 0, 0, 0, 0, 0, 0, 0, 0, 0, 0, 0, 0, 0, 1, 0, 0, 0, 0, 0, 0, 0, 0, 0, 0, 0, 0, 0, 0, 0, 0, 0, 0, 0, 0, 0, 0, 0, 0, ...
- $ left <int> 1, 1, 1, 1, 1, 1, 1, 1, 1, 1, 1, 1, 1, 1, 1, 1, 1, 1, 1, 1, 1, 1, 1, 1, 1, 1, 1, 1, 1, 1, 1, 1, 1, 1, 1, 1, 1, 1, 1, 1, 1, 1, 1, ...
- $ promotion_last_5years <int> 0, 0, 0, 0, 0, 0, 0, 0, 0, 0, 0, 0, 0, 0, 0, 0, 0, 0, 1, 0, 0, 0, 0, 0, 0, 0, 0, 0, 0, 0, 0, 0, 0, 0, 0, 0, 0, 0, 0, 0, 0, 0, 0, ...
- $ sales <chr> "sales", "sales", "sales", "sales", "sales", "sales", "sales", "sales", "sales", "sales", "sales", "sales", "sales", "sales", "sa...
- $ salary <chr> "low", "medium", "medium", "low", "low", "low", "low", "low", "low", "low", "low", "low", "low", "low", "low", "low", "low", "low...
- satisfaction_level last_evaluation number_project average_montly_hours time_spend_company Work_accident left
- 0 0 0 0 0 0 0
- promotion_last_5years sales salary
- 0 0 0
數據集情況如下,一共10維數據,14999個觀測值,變量的代表名稱分別是
satisfaction_level--滿意度,last_evaluation--***一次評估,number_project--參與項目數量,average_montly_hours--每月平均工作時間,time_spend_company--公司停留時間,Work_accident--工作事故次數,left--是否離職,promotion_last_5years--過去五年升值狀況,sales--工種,salary--工資。
而且簡單的觀測了一下,沒有發現缺失值,那么我就可以直接進入數據分析階段了。
數據預處理
根據每一個特征的數值情況,我們可以將不少特征因子化,方便后期做不同類別的差異分析。
- hr$sales<-as.factor(hr$sales)
- hr$salary<-as.factor(hr$salary)
- hr$left<-as.factor(hr$left)
- hr$Work_accident<-as.factor(hr$Work_accident)
- hr$left<-recode(hr$left,'1'="yes",'0'="no")
- hr$promotion_last_5years<-as.factor(hr$promotion_last_5years)
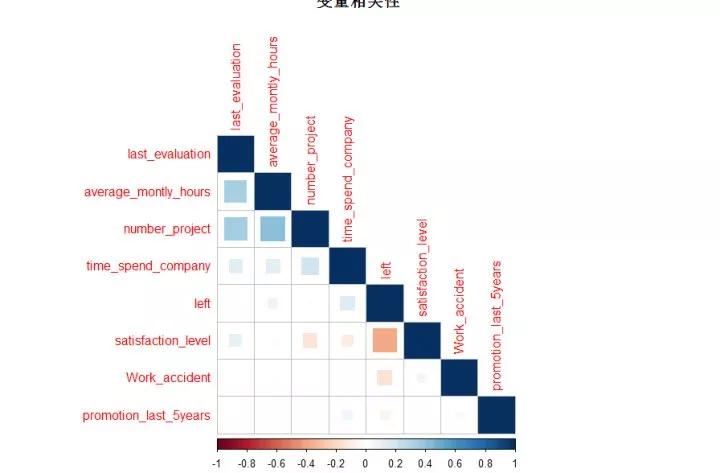
看的出大部分數據都是數值型的,我們使用相關性來衡量不同變量之間的相關性高低:
- cor.hr<-hr %>% select(-sales,-salary)
- cor.hr$Work_accident<-as.numeric(as.character(cor.hr$Work_accident))
- cor.hr$promotion_last_5years<-as.numeric(as.character(cor.hr$promotion_last_5years))
- cor.hr$left<-as.numeric(as.character(cor.hr$left))
- corrplot(corr = cor(cor.hr),type = "lower",method = "square",title="變量相關性",order="AOE")
直觀的來看,是否離職和滿意度高低就有很高的關聯性啊。
EDA
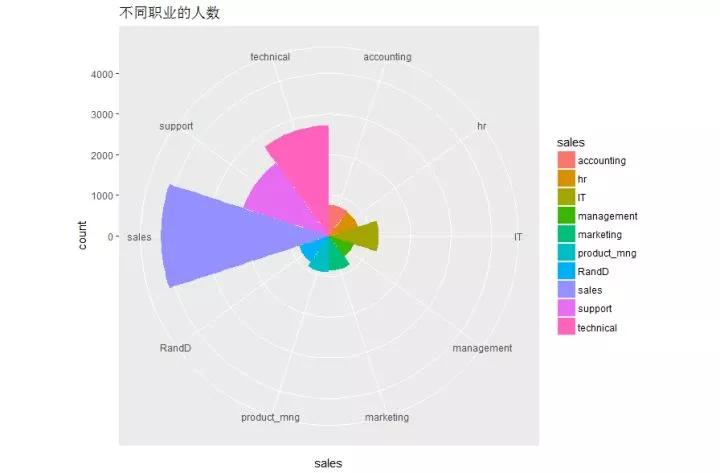
- ggplot(group_by(hr,sales),aes(x=sales,fill=sales))+geom_bar(width = 1)+coord_polar(theta = "x")+ggtitle("不同職業的人數")
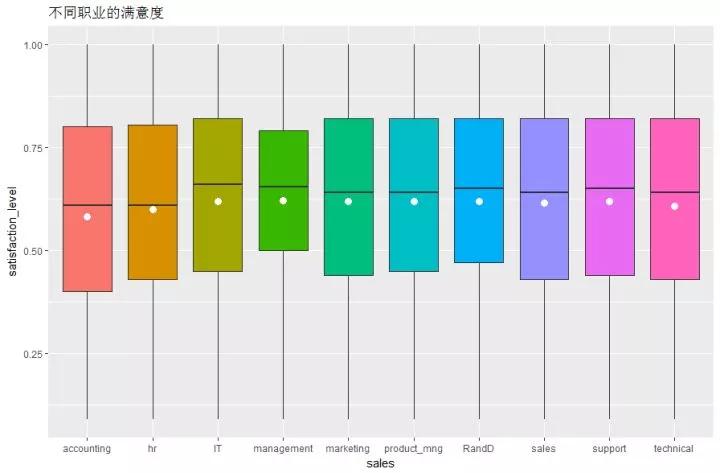
- ggplot(hr,aes(x=sales,y=satisfaction_level,fill=sales))+geom_boxplot()+ggtitle("不同職業的滿意度")+stat_summary(fun.y = mean,size=3,color='white',geom = "point")+
- theme(legend.position = "none")
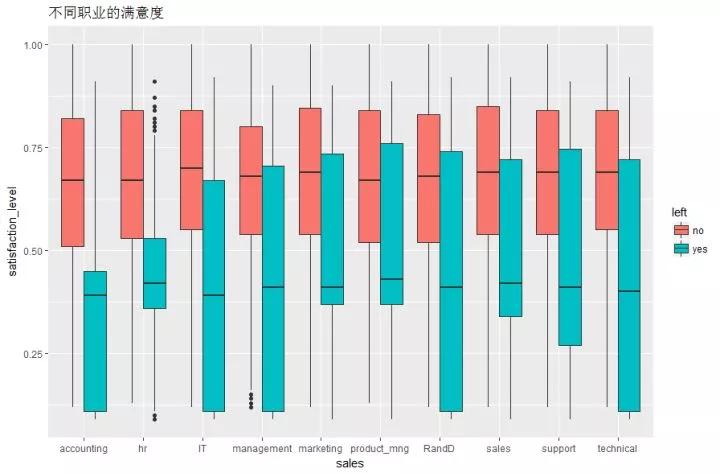
- ggplot(hr,aes(x=sales,y=satisfaction_level,fill=left))+geom_boxplot()+ggtitle("不同職業的滿意度")
- ggplot(hr,aes(x=sales,y=average_montly_hours,fill=left))+geom_boxplot()+ggtitle("不同職業的工作時長")
- ggplot(hr,aes(x=sales,y=number_project,fill=left))+geom_boxplot()+ggtitle("不同職業的項目情況")
首先觀察不同崗位的工作人數。搞銷售的人數真的是不少,難道有不少我大生科的同學嗎??(哈哈哈哈哈哈哈,開個玩笑而已,不過說實話做生物真的很累啊)。銷售,后期支持,和技術崗人數占據人數排行榜前三。
不同的職業滿意度的分布大體相當,不過accounting的小伙伴們似乎打分都不高哦,其他的幾個工種均值和中位數都沒有明顯差別,接下來我們看看不同職業是否離職的情況和打分的高低情況:
和想象中結果幾乎沒有區別,離職和不離職的打分區分度很高,和職業幾乎沒有關系。
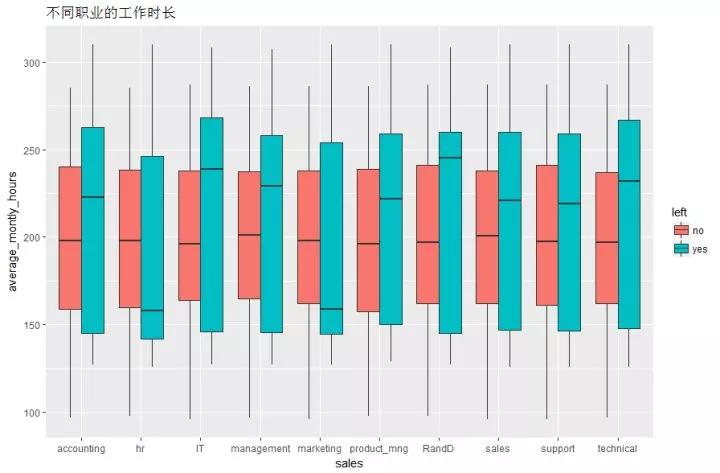
那么不同職業的平均工作時長呢,看圖而言,沒有離職的人群工作時間都很穩定,但是離職人群的工作時間呈現兩極分化的趨勢,看來太忙和太閑都不是很好,這對hr的考驗還是很大的。
后面我們來一次關注一下不同特征和離職的關系問題:
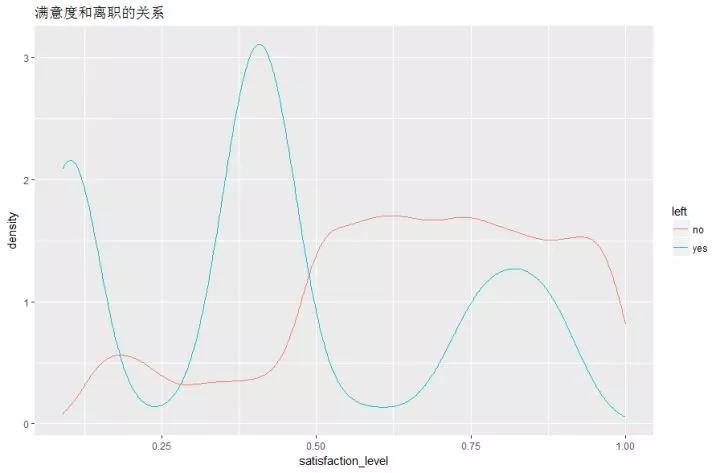
- ggplot(hr,aes(x=satisfaction_level,color=left))+geom_line(stat = "density")+ggtitle("滿意度和離職的關系")
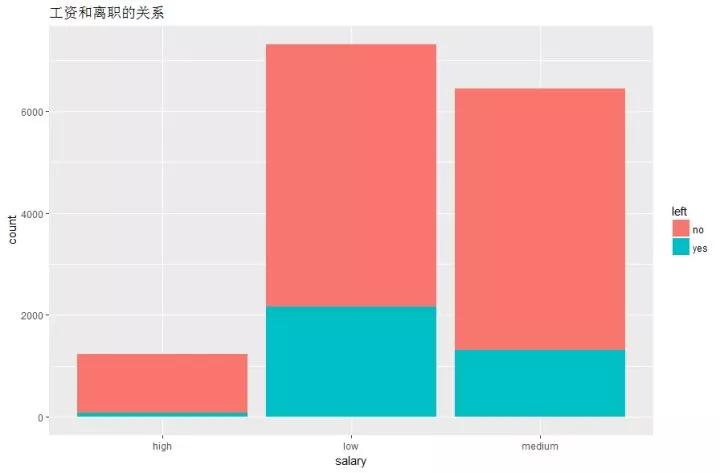
- ggplot(hr,aes(x=salary,fill=left))+geom_histogram(stat="count")+ggtitle("工資和離職的關系")
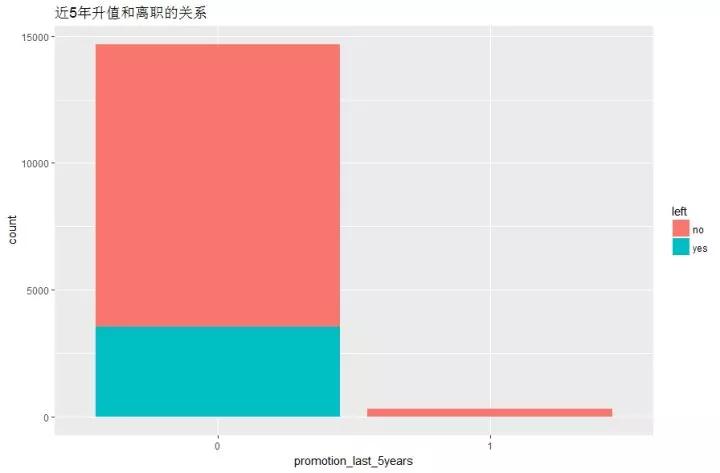
- ggplot(hr,aes(x=promotion_last_5years,fill=left))+geom_histogram(stat="count")+ggtitle("近5年升值和離職的關系")
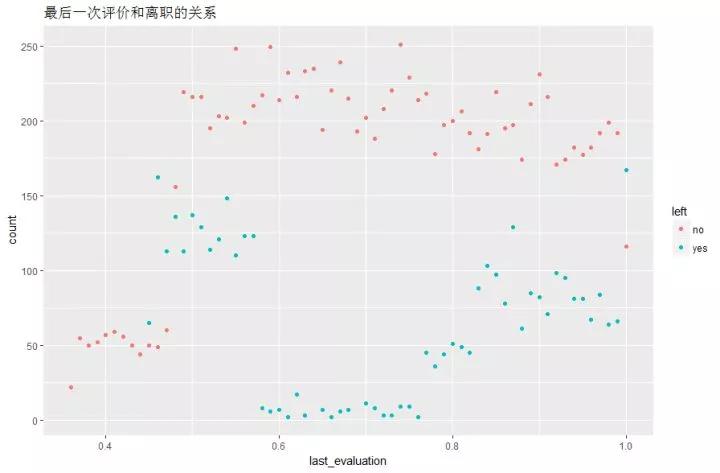
- ggplot(hr,aes(x=last_evaluation,color=left))+geom_point(stat = "count")+ggtitle("***一次評價和離職的關系")
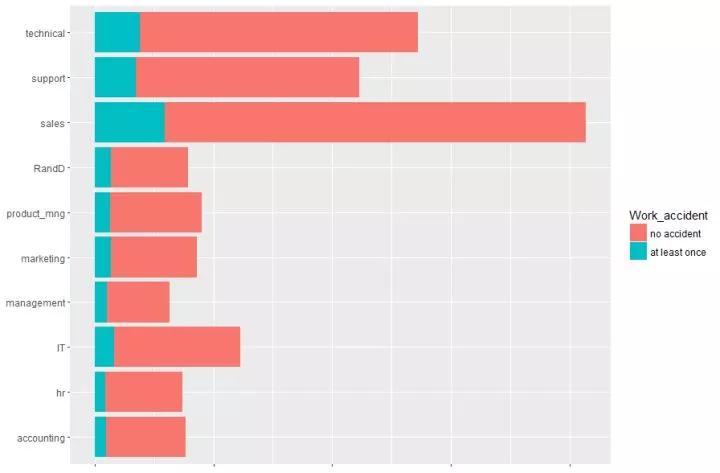
- hr %>% group_by(sales) %>% ggplot(aes(x=sales,fill=Work_accident))+geom_bar()+coord_flip()+
- theme(axis.text.x = element_blank(),axis.title.x = element_blank(),axis.title.y = element_blank())+scale_fill_discrete(labels=c("no accident","at least once"))
沒有離職的人群打分已知非常穩定,而離職人群的打分就有點難以估摸了
還是那句話,“有錢好辦事啊”
你不給寶寶升職,寶寶就生氣離職
和前面的面積圖差不多,hr也要警惕那些***一次打分很高的,雖然大部分是不準備離職的,但是有些為了給老東家面子還是會來點“善意的謊言”的。
不出錯是不可能的,出錯人數多少基本和總人數成正比,所以這個對于離職來說不是問題。
模型構建和評估
- index<-sample(2,nrow(hr),replace = T,prob = c(0.7,0.3))
- train<-hr[index==1,];test<-hr[index==2,]
- model<-randomForest(left~.,data = train)
- predict.hr<-predict(model,test)
- confusionMatrix(test$left,predict.hr)
- prob.hr<-predict(model,test,type="prob")
- roc.hr<-roc(test$left,prob.hr[,2],levels=levels(test$left))
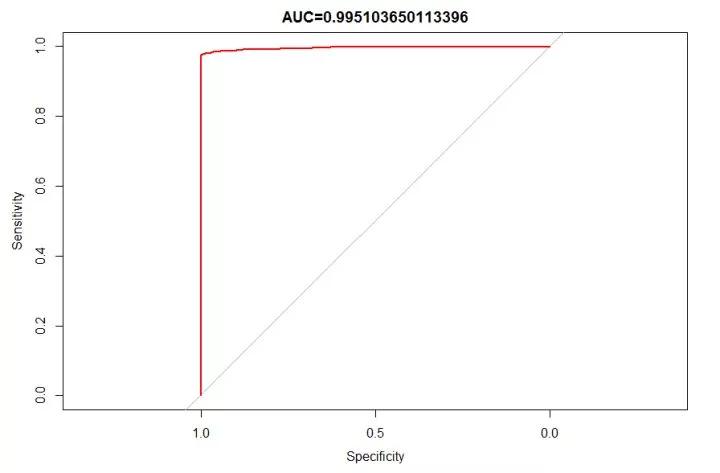
- plot(roc.hr,type="S",col="red",main = paste("AUC=",roc.hr$auc,sep = ""))
根據前面的特征分析,本次答主并沒有覺得有很好的特征來提取,就直接扔進算法里面計算去了,計算出來的混淆矩陣的情況效果還是杠杠的:
- Confusion Matrix and Statistics
- Reference
- Prediction no yes
- no 3429 5
- yes 28 1010
- Accuracy : 0.9926
- 95% CI : (0.9897, 0.9949)
- No Information Rate : 0.773
- P-Value [Acc > NIR] : < 2.2e-16
- Kappa : 0.9791
- Mcnemar's Test P-Value : 0.0001283
- Sensitivity : 0.9919
- Specificity : 0.9951
- Pos Pred Value : 0.9985
- Neg Pred Value : 0.9730
- Prevalence : 0.7730
- Detection Rate : 0.7668
- Detection Prevalence : 0.7679
- Balanced Accuracy : 0.9935
- 'Positive' Class : no
acc=0.9926,recall=0.9951,precision=0.9730,基本都是逆天的數據了,看來kaggle的數據集已經清洗的很棒了,rf算法也是一如既往地給力。***貼出ROC曲線的圖
寫在***
本次分析其實并沒有很多的技巧可言,答主的ggplot2水平也遇到了瓶頸期,后期需要不斷加強,而且只會調包不懂算法后面的原理更是不可以的,所以最近在慢慢把概率論,線性代數,還是統計學撿起來,當然R語言的數據分析實踐還是不會停下來的,答主英語還不錯,可以和實驗室的老外教授“忽悠”幾句,也算是有了不少的進步。
道阻且長,大家共勉~~~


