穩定輸出加速開發:數據科學項目開始時應該包括的7個設置
本文轉載自公眾號“讀芯術”(ID:AI_Discovery)。
在開始一項數據科學項目時,我們通常需要進行設置或配置,以確保所需的依賴關系,保持輸出穩定,準備通用函數。
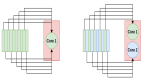
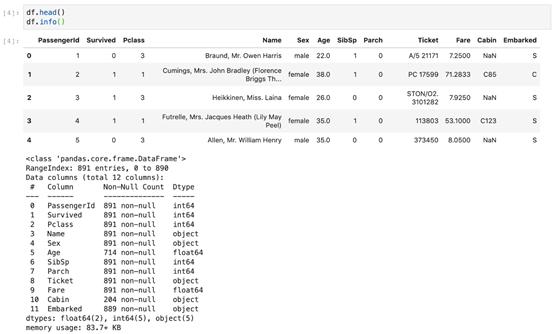
項目設置的一個案例(來自Handson-ML2)
本文將介紹JuypterNotebook中最有幫助的一些項目設置。
1. 確保Python版本
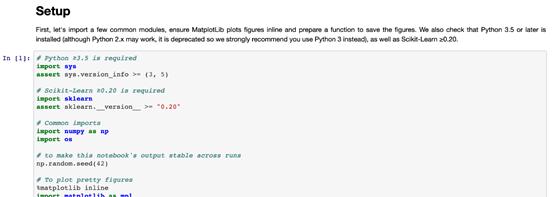
檢查JupyterNotebook中的Python解釋器版本:
- import sys
- sys.version'3.7.6 (default, Jan 8 2020, 13:42:34) \n[Clang 4.0.1 (tags/RELEASE_401/final)]'
為確保項目由Python解釋器的最低及以上要求版本運行,可在項目設置中添加以下代碼:
- # Python ≥3.7 is required
- import sys
- assert sys.version_info >= (3, 7)
Python需要為3.7及以上版本,否則會拋出AssertionError。
2. 確保程序包版本
檢查安裝的程序包版本,如TensorFlow。
- import tensorflow as tf
- tf.__version__'2.0.0'
確保項目是由TensorFlow2.0及以上版本運行的,否則會拋出AssertionError。
- # TensorFlow ≥2.0 is required
- import tensorflow as tf
- assert tf.__version__ >= "2.0"
3. 避免繪制模糊圖像
JuypterNotebook中的默認繪圖看起來有些模糊。例如,一張查找缺失值的簡單熱圖。
(https://towardsdatascience.com/using-pandas-pipe-function-to-improve-code-readability-96d66abfaf8)
- import seaborn as sns
- import matplotlib.pyplot as plt
- %matplotlib inline# Default figure format png
- sns.heatmap(df.isnull(),
- yticklabels=False,
- cbar=False,
- cmap='viridis')
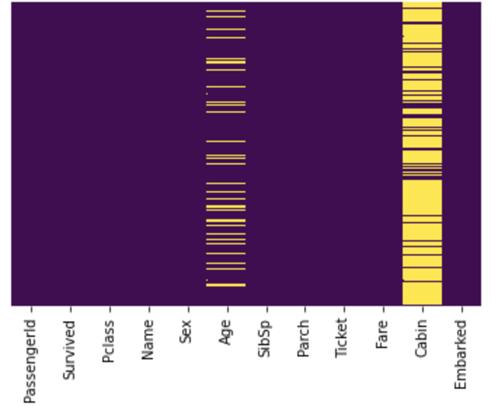
默認圖像看起來很模糊
由上圖可以看出,文本很模糊,Cabin欄中的缺失值過于擁擠,Embarked欄中的缺失值無法識別。
要解決這個問題,可在%matplotlib inline之后使用%config InlineBackend.figure_format='retina'或 %configInlineBackend.figure_format = 'svg',即:
- %matplotlib inline
- %config InlineBackend.figure_format = 'retina' # or 'svg'sns.heatmap(df.isnull(),
- yticklabels=False,
- cbar=False,
- cmap='viridis')
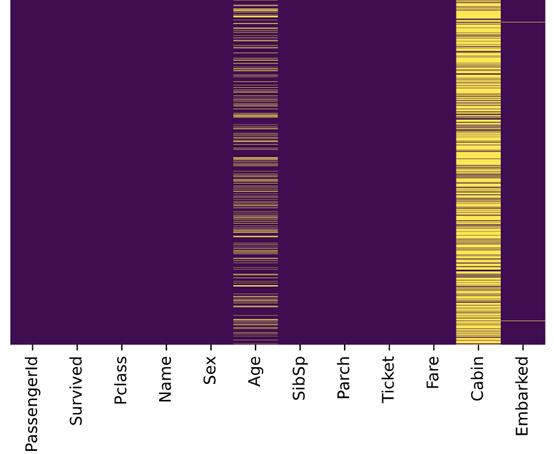
圖片格式設置為retina或svg
與先前的圖片比較,上圖更加清晰,Embarked欄中的缺失值也能成功識別。
4. 在不同運行中保持輸出穩定
數據科學項目中很多地方都在使用隨機數字。例如:
- 來自Scikit-Learn的 train_test_split()
- 用于初始化權重的np.random.rand()
若未重置隨機種子,則每次調用都會出現不同的數字:
- >>> np.random.rand(4)
- array([0.83209492, 0.10917076, 0.15798519, 0.99356723])
- >>> np.random.rand(4)
- array([0.46183001, 0.7523687 , 0.96599624, 0.32349079])
np.random.seed(0)使隨機數字可預測:
- >>> np.random.seed(0)
- >>> np.random.rand(4)
- array([0.5488135 , 0.71518937, 0.60276338, 0.54488318])
- >>> np.random.seed(0)
- >>> np.random.rand(4)
- array([0.5488135 , 0.71518937, 0.60276338, 0.54488318])
如果(每次)都重置隨機種子,那么每次都會出現相同的數據組。因此,項目能在不同運行中保持輸出穩定。
5. 多單元輸出
默認情況下,JupyterNotebook不能在同一單元中輸出多種結果。要輸出多種結果,可使用IPython重新配置shell。
- from IPython.core.interactiveshell import InteractiveShell
- InteractiveShell.ast_node_interactivity = "all"
6. 將圖片保存到文件
Matplotlib能通過savefig()方法保存圖片,但如果給定路徑不存在則會引發錯誤。
- plt.savefig('./figures/my_plot.png')FileNotFoundError: [Errno 2] Nosuch file or directory: './figures/my_plot.png'
最好的做法是將所有圖片都放到一個地方,如工作區的figures文件夾。可使用OS GUI(操作系統界面)或是在JupyterNotebook中運行logic指令,來手動創建一個figures文件夾,但是最好創建一個小函數來實現該操作。
當需要一些自定義圖形設置或附加子文件夾來分組圖形時,這種方法尤其適用。以下是將圖片保存到文件的函數:
- import os
- %matplotlib inline
- import matplotlib.pyplot as plt# Where to save the figures
- PROJECT_ROOT_DIR = "."
- SUB_FOLDER = "sub_folder" #a sub-folder
- IMAGES_PATH = os.path.join(PROJECT_ROOT_DIR, "images", SUB_FOLDER)defsave_fig(name, images_path=IMAGES_PATH, tight_layout=True,extension="png", resolution=300):
- if not os.path.isdir(images_path):
- os.makedirs(images_path)
- path = os.path.join(images_path, name+ "." + extension)
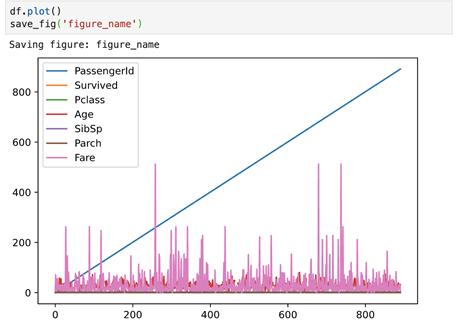
- print("Saving figure:",name)
- if tight_layout:
- plt.tight_layout()
- plt.savefig(path, format=extension,dpi=resolution)
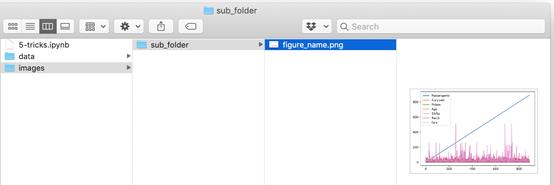
現在調用save_fig('figure_name'),會在工作區中創建一個images/sub_folder目錄,圖片以“figure_name.png”名稱被保存到目錄中。此外,還提供了三個最常用的設置:
- tight_layout 能自動調整子圖填充
- extension 能以多種格式保存圖片
- resolution 可設置圖片分辨率
7. 下載數據(并解壓)
處理網絡數據對于數據科學工作者是常事。可以使用瀏覽器下載數據,并運行指令來解壓文件,但最好的是創建一個小函數來執行該操作。當數據需要定期更改時,這一點尤其重要。
編寫一個小腳本,在獲取最新數據時運行(也可以設置一個定期自動執行的計劃工作)即可。如果需要在多臺機器上安裝數據集,自動化抓取數據流程也十分有用。
以下是下載并解壓數據的函數:
- import os
- import tarfile
- import zipfile
- import urllib
- # Where to save the data
- PROJECT_ROOT_DIR = "."
- SUB_FOLDER = "group_name"
- LOCAL_PATH = os.path.join(PROJECT_ROOT_DIR, "datasets", SUB_FOLDER)defdownload(file_url, local_path = LOCAL_PATH):
- if not os.path.isdir(local_path):
- os.makedirs(local_path)
- # Download file
- print(">>>downloading")
- filename = os.path.basename(file_url)
- file_local_path =os.path.join(local_path, filename)
- urllib.request.urlretrieve(file_url,file_local_path)
- # untar/unzip file
- if filename.endswith("tgz")or filename.endswith("tar.gz"):
- print(">>>unpacking file:", filename)
- tar =tarfile.open(file_local_path, "r:gz")
- tar.extractall(path = local_path)
- tar.close()
- eliffilename.endswith("tar"):
- print(">>> unpackingfile:", filename)
- tar =tarfile.open(file_local_path, "r:")
- tar.extractall(path = local_path)
- tar.close()
- eliffilename.endwith("zip"):
- print(">>>unpacking file:", filename)
- zip_file = zipfile.ZipFile(file_local_path)
- zip_file.extractall(path =local_path)
- zip_file.close()
- print("Done")
現在調用download("http://a_valid_url/housing.tgz"),會在工作區創建一個datasets/group_name目錄,下載housing.tgz,并從該目錄中提取出housing.csv ,這個小函數也能用于CSV和文本文件。
圖源:unsplash
請查看筆者Github庫中的源代碼:
https://github.com/BindiChen/machine-learning/blob/master/data-analysis/004-7-setups-for-a-data-science-project/7-setups.ipynb