Get了!用Python制作數據預測集成工具
作者:李秋鍵
大數據預測是大數據最核心的應用,是它將傳統意義的預測拓展到“現測”。大數據預測的優勢體現在,它把一個非常困難的預測問題,轉化為一個相對簡單的描述問題,而這是傳統小數據集根本無法企及的。
大數據預測是大數據最核心的應用,是它將傳統意義的預測拓展到“現測”。大數據預測的優勢體現在,它把一個非常困難的預測問題,轉化為一個相對簡單的描述問題,而這是傳統小數據集根本無法企及的。從預測的角度看,大數據預測所得出的結果不僅僅是用于處理現實業務的簡單、客觀的結論,更是能用于幫助企業經營的決策。
在過去,人們的決策主要是依賴 20% 的結構化數據,而大數據預測則可以利用另外 80% 的非結構化數據來做決策。大數據預測具有更多的數據維度,更快的數據頻度和更廣的數據寬度。與小數據時代相比,大數據預測的思維具有 3 大改變:實樣而非抽樣;預測效率而非精確;相關關系而非因果關系。
而今天我們就將利用python制作可視化的大數據預測部分集成工具,其中數據在這里使用一個實驗中的數據。普遍性的應用則直接從文件讀取即可。其中的效果圖如下:

實驗前的準備
首先我們使用的python版本是3.6.5所用到的模塊如下:
- sklearn模塊用來創建整個模型訓練和保存調用以及算法的搭建框架等等。
- numpy模塊用來處理數據矩陣運算。
- matplotlib模塊用來可視化擬合模型效果。
- Pillow庫用來加載圖片至GUI界面。
- Pandas模塊用來讀取csv數據文件。
- Tkinter用來創建GUI窗口程序。
數據的訓練和訓練的GUI窗口
經過算法比較,發現這里我們選擇使用sklearn簡單的多元回歸進行擬合數據可以達到比較好的效果。
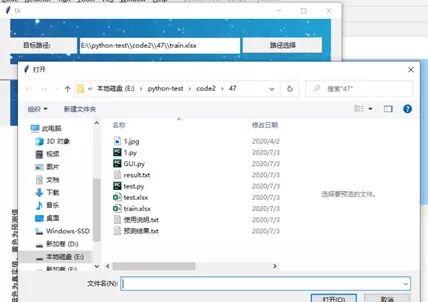
(1)首先是是數據的讀取,通過設定選定文件夾函數來讀取文件,加載數據的效果:
- '''選擇文件功能'''
- def selectPath():
- # 選擇文件path_接收文件地址
- path_ =tkinter.filedialog.askopenfilename()
- # 通過replace函數替換絕對文件地址中的/來使文件可被程序讀取
- # 注意:\\轉義后為\,所以\\\\轉義后為\\
- path_ =path_.replace("/", "\\\\")
- # path設置path_的值
- path.set(path_)
- return path
- # 得到的DataFrame讀入所有數據
- data = pd.read_excel(FILENAME, header=0, usecols="A,B,C,D,E,F,G,H,I")
- # DataFrame轉化為array
- DataArray = data.values
- # 讀取已使用年限作為標簽
- Y = DataArray[:, 8]
- # 讀取其他參數作為自變量,影響因素
- X = DataArray[:, 0:8]
- # 字符串轉變為整數
- for i in range(len(Y)):
- Y[i] = int(Y[i].replace("年", ""))
- X = np.array(X) # 轉化為array
- Y = np.array(Y) # 轉化為array
- root = Tk()
- root.geometry("+500+260")
- # 背景圖設置
- canvas = tk.Canvas(root, width=600, height=200, bd=0, highlightthickness=0)
- imgpath = '1.jpg'
- img = Image.open(imgpath)
- photo = ImageTk.PhotoImage(img)
- #背景圖大小設置
- canvas.create_image(700, 400, image=photo)
- canvas.pack()
- path = StringVar()
- #標簽名稱位置
- label1=tk.Label(text = "目標路徑:")
- label1.pack()
- e1=tk.Entry( textvariable = path)
- e1.pack()
- bn1=tk.Button(text = "路徑選擇", command = selectPath)
- bn1.pack()
- bn2=tk.Button(text = "模型訓練", command = train)
- bn2.pack()
- bn3=tk.Button(text = "模型預測", command = test)
- bn3.pack()
- #標簽按鈕等放在背景圖上
- canvas.create_window(50, 50, width=150, height=30,
- window=label1)
- canvas.create_window(280, 50, width=300, height=30,
- window=e1)
- canvas.create_window(510, 50, width=150, height=30,
- window=bn1)
- canvas.create_window(50, 100, width=150, height=30,
- window=bn2)
- canvas.create_window(510, 100, width=150, height=30,
- window=bn3)
- root.mainloop()
效果如下可見:
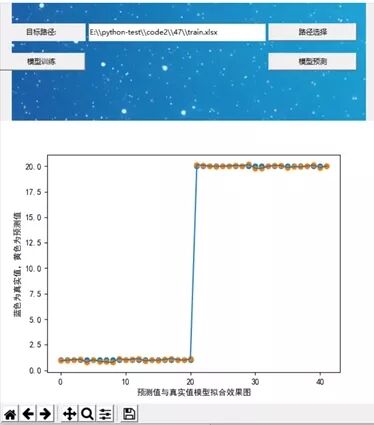
(2)然后是數據的擬合和可視化模型效果:
- # 模型擬合
- reg = LinearRegression()
- reg.fit(X, Y)
- # 預測效果
- predict = reg.predict(np.array([X[0]]))
- Y_predict = reg.predict(X)
- print(Y_predict)
- # 橫坐標
- x_label = []
- for i in range(len(Y)):
- x_label.append(i)
- # 繪圖
- fig, ax = plt.subplots()
- # 真實值分布散點圖
- plt.scatter(x_label, Y)
- # 預測值分布散點圖
- plt.scatter(x_label, Y_predict)
- # 預測值擬合直線圖
- plt.plot(x_label, Y_predict)
- # 橫縱坐標
- ax.set_xlabel('預測值與真實值模型擬合效果圖')
- ax.set_ylabel('藍色為真實值,黃色為預測值')
- # 將繪制的圖形顯示到tkinter:創建屬于root的canvas畫布,并將圖f置于畫布上
- canvas = FigureCanvasTkAgg(fig, master=root)
- canvas.draw() # 注意show方法已經過時了,這里改用draw
- canvas.get_tk_widget().pack()
- # matplotlib的導航工具欄顯示上來(默認是不會顯示它的)
- toolbar = NavigationToolbar2Tk(canvas, root)
- toolbar.update()
- canvas._tkcanvas.pack()
- #彈窗顯示
- messagebox.showinfo(title='模型情況', message="模型訓練完成!")
- 其中的效果如下可見:
其中的效果如下可見:
模型的預測和使用
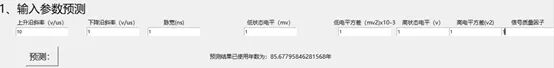
其中模型的預測主要通過兩種方式進行預測,分別是:手動輸入單個數據進行預測和讀取文件進行預測。
其中手動輸入數據進行預測需要設置更多的GUI按鈕,其中代碼如下:
- #子窗口
- LOVE = Toplevel(root)
- LOVE.geometry("+100+260")
- LOVE.title = "模型測試"
- #子窗口各標簽名
- label = ["上升沿斜率(v/us)", "下降沿斜率(v/us)", "脈寬(ns)", "低狀態電平(mv)", "低電平方差(mv2)x10-3", "高狀態電平(v)", "高電平方差(v2)", "信號質量因子"]
- Label(LOVE, text="1、輸入參數預測", font=("微軟雅黑", 20)).grid(row=0, column=0)
- #標簽名稱,字體位置
- Label(LOVE, text=label[0], font=("微軟雅黑",10)).grid(row=1, column=0)
- Label(LOVE, text=label[1], font=("微軟雅黑", 10)).grid(row=1, column=1)
- Label(LOVE, text=label[2], font=("微軟雅黑", 10)).grid(row=1, column=2)
- Label(LOVE, text=label[3], font=("微軟雅黑", 10)).grid(row=1, column=3)
- Label(LOVE, text=label[4], font=("微軟雅黑", 10)).grid(row=1, column=4)
- Label(LOVE, text=label[5], font=("微軟雅黑", 10)).grid(row=1, column=5)
- Label(LOVE, text=label[6], font=("微軟雅黑", 10)).grid(row=1, column=6)
- Label(LOVE, text=label[7], font=("微軟雅黑", 10)).grid(row=1, column=7)
- #編輯框位置和字體
- en1=tk.Entry(LOVE, font=("微軟雅黑", 8))
- en1.grid(row=2, column=0)
- en2=tk.Entry(LOVE, font=("微軟雅黑", 8))
- en2.grid(row=2, column=1)
- en3=tk.Entry(LOVE, font=("微軟雅黑", 8))
- en3.grid(row=2, column=2)
- en4=tk.Entry(LOVE, font=("微軟雅黑", 8))
- en4.grid(row=2, column=3)
- en5=tk.Entry(LOVE, font=("微軟雅黑", 8))
- en5.grid(row=2, column=4)
- en6=tk.Entry(LOVE, font=("微軟雅黑", 8))
- en6.grid(row=2, column=5)
- en7=tk.Entry(LOVE, font=("微軟雅黑", 8))
- en7.grid(row=2, column=6)
- en8=tk.Entry(LOVE, font=("微軟雅黑", 8))
- en8.grid(row=2, column=7)
- Label(LOVE, text="", font=("微軟雅黑", 10)).grid(row=3, column=0)
- #測試輸入框預測
- def pp():
- x=np.array([int(en1.get()),int(en2.get()),int(en3.get()),int(en4.get()),int(en5.get()),int(en6.get()),int(en7.get()),int(en8.get())])
- # 預測效果
- predict = reg.predict(np.array([x]))
- Label(LOVE, text="預測結果已使用年數為:"+str(predict[0])+"年", font=("微軟雅黑", 10)).grid(row=4, column=3)
- print(predict)
- Button(LOVE, text="預測:", font=("微軟雅黑", 15),command=pp).grid(row=4, column=0)
- Label(LOVE, text="2、選擇文件預測", font=("微軟雅黑", 20)).grid(row=5, column=0)
- path1 = StringVar()
- label1 = tk.Label(LOVE,text="目標路徑:", font=("微軟雅黑", 10))
- label1.grid(row=6, column=0)
- e1 = tk.Entry(LOVE,textvariable=path1, font=("微軟雅黑", 10))
- e1.grid(row=6, column=2)
- label = ["上升沿斜率(v/us)", "下降沿斜率(v/us)", "脈寬(ns)", "低狀態電平(mv)", "低電平方差(mv2)x10-3", "高狀態電平(v)", "高電平方差(v2)",
- "信號質量因子"]
- n = 0
- for i in predict_value:
- print(str(label) + "分別為" + str(X[n]) + "預測出來的結果為:" + str(i) + "年" + "\n")
- f = open("預測結果.txt", "a")
- f.write(str(label) + "分別為" + str(X[n]) + "預測出來的結果為:" + str(i) + "年" + "\n")
- f.close()
- f = open("result.txt", "a")
- f.write(str(i) + "\n")
- f.close()
- n += 1
- messagebox.showinfo(title='模型情況', message="預測結果保存在當前文件夾下的TXT文件中!")
- os.system("result.txt")
- os.system("預測結果.txt")
- Button(LOVE, text="預測:", font=("微軟雅黑", 15), command=ppt).grid(row=7, column=0)
效果如下可見:
選擇文件進行讀取預測和模型訓練數據的讀取類似,代碼如下:
- #選擇文件預測
- def selectPath1():
- # 選擇文件path_接收文件地址
- path_ =tkinter.filedialog.askopenfilename()
- # 通過replace函數替換絕對文件地址中的/來使文件可被程序讀取
- # 注意:\\轉義后為\,所以\\\\轉義后為\\
- path_ =path_.replace("/", "\\\\")
- # path設置path_的值
- path1.set(path_)
- return path
- bn1 = tk.Button(LOVE,text="路徑選擇", font=("微軟雅黑", 10), command=selectPath1)
- bn1.grid(row=6, column=6)
- def ppt():
- try:
- os.remove("預測結果.txt")
- os.remove("result.txt")
- except:
- pass
- # 文件的名字
- FILENAME =path1.get()
- # 禁用科學計數法
- pd.set_option('float_format', lambda x: '%.3f' % x)
- np.set_printoptions(threshold=np.inf)
- # 得到的DataFrame讀入所有數據
- data =pd.read_excel(FILENAME, header=0, usecols="A,B,C,D,E,F,G,H")
- # DataFrame轉化為array
- DataArray =data.values
- # 讀取其他參數作為自變量,影響因素
- X = DataArray[:,0:8]
- predict_value = reg.predict(X)
- print(predict_value)
效果如下:
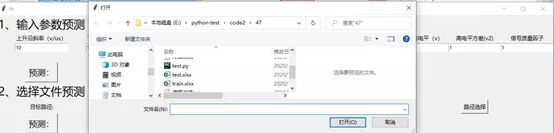
由于讀取文件進行預測的話,數據較多故直接存儲在TXT中方便查看:
責任編輯:華軒
來源:
AI科技大本營