使用Flux+Flagger+Istio+Kubernetes實戰GitOps云原生漸進式(金絲雀)交付
在這篇指南中,你將獲得使用 Kubernetes 和 Istio 使用 GitOps 進行漸進式交付(Progressive Delivery)的實際經驗。
介紹
Demo: https://github.com/stefanprodan/gitops-istio
GitOps 是什么?
GitOps 是一種進行持續交付的方式,它使用 Git 作為聲明性(declarative)基礎設施和工作負載(workloads)的真實來源。對于 Kubernetes,這意味著使用 git push 而不是 kubectl apply/delete 或 helm install/upgrade。
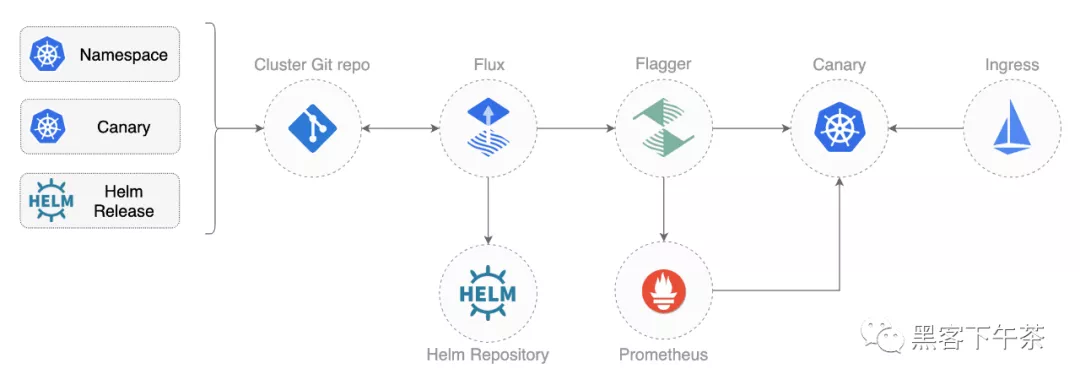
在這個 workshop 中,您將使用 GitHub 來托管配置存儲庫,并將 Flux 作為 GitOps 交付解決方案。
什么是漸進式交付?
漸進交付是高級部署模式(如金絲雀canaries、功能標志feature flags和A/B測試A/B testing)的總稱。漸進交付技術通過讓應用程序開發人員和 SRE 團隊對爆炸半徑blast radius進行細粒度控制,從而降低在生產中引入新軟件版本的風險。
在這個 workshop 中,您將使用 Flagger 和 Prometheus 為您的應用程序自動執行 Canary 發布和 A/B Testing。
準備工作
您將需要具有 LoadBalancer 支持的 Kubernetes 集群 v1.16 或更高版本。出于測試目的,您可以使用帶有 2 個 CPU 和 4GB 內存的 Minikube。
使用 Homebrew 安裝 flux CLI:
- brew install fluxcd/tap/flux
macOS AMD64/ARM64、Linux AMD64/ARM 和 Windows 的二進制文件可在 flux2 release page 下載。
驗證您的集群是否滿足前提條件:
- flux check --pre
使用 Homebrew 安裝 jq 和 yq:
- brew install jq yq
Fork 這個倉庫并克隆它:
- git clone https://github.com/<YOUR-USERNAME>/gitops-istio
- cd gitops-istio
Cluster bootstrap
使用 flux bootstrap 命令,您可以在 Kubernetes 集群上安裝 Flux 并將其配置為從 Git 存儲庫管理自身。如果集群上存在 Flux 組件,則 bootstrap 命令將在需要時執行升級。
通過指定您的 GitHub 存儲庫 fork URL 來引導 Flux:
- flux bootstrap git \
- --author-email=<YOUR-EMAIL> \
- --url=ssh://git@github.com/<YOUR-USERNAME>/gitops-istio \
- --branch=main \
- --path=clusters/my-cluster
上面的命令需要 ssh-agent,如果您使用的是 Windows,請參閱 flux bootstrap github 文檔。
在引導時,Flux 生成一個 SSH key 并打印 public key。為了用 git 同步你的集群狀態,你需要復制 public key 并使用 write 創建一個 deploy key 訪問你的 GitHub 倉庫。在 GitHub 上轉到 Settings > Deploy keys 點擊 Add deploy key, 勾選☑️ Allow write access,粘貼 Flux public key 并單擊 Add key。
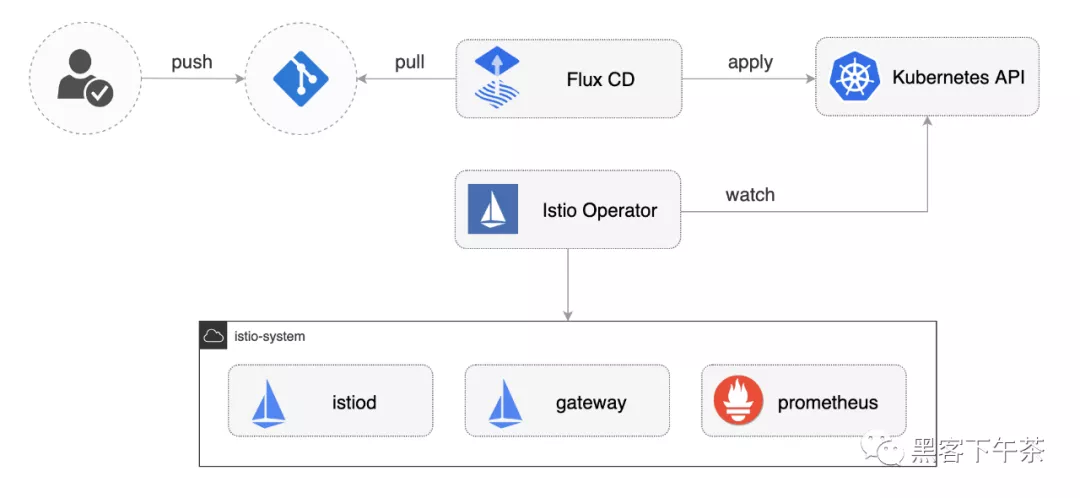
當 Flux 訪問你的存儲庫時,它會做以下事情:
- 安裝 Istio operator
- 等待 Istio 控制平面準備好
- 安裝 Flagger、Prometheus 和 Grafana
- 創建 Istio 公共網關
- 創建 prod 命名空間namespace
- 創建負載測試器(load tester) deployment
- 創建前端(frontend) deployment 和金絲雀canary
- 創建后端(backend) deployment 和金絲雀canary
使用 Istio 引導集群時,定義 apply 順序很重要。對于要使用 Istio sidecar 注入的應用程序 pod,Istio 控制平面必須在應用程序之前啟動并運行。
在 Flux v2 中,你可以通過定義對象之間的依賴關系來指定執行順序。例如,在 clusters/my-cluster/apps.yaml 中我們告訴 Flux,apps 的協調取決于一個 istio-system :
- apiVersion: kustomize.toolkit.fluxcd.io/v1beta1
- kind: Kustomization
- metadata:
- name: apps
- namespace: flux-system
- spec:
- interval: 30m0s
- dependsOn:
- - name: istio-system
- sourceRef:
- kind: GitRepository
- name: flux-system
- path: ./apps
首先觀測 Flux 安裝 Istio,然后觀測 demo apps:
- watch flux get kustomizations
您可以使用以下命令跟蹤 Flux reconciliation 日志:
- flux logs --all-namespaces --follow --tail=10
Istio 定制和升級
您可以使用位于 istio/system/profile.yaml 的 IstioOperator 資源自定義 Istio 安裝:
- apiVersion: install.istio.io/v1alpha1
- kind: IstioOperator
- metadata:
- name: istio-default
- namespace: istio-system
- spec:
- profile: demo
- components:
- pilot:
- k8s:
- resources:
- requests:
- cpu: 10m
- memory: 100Mi
修改 Istio 設置后,您可以將更改推送到 git,Flux 將在集群上應用它。Istio operator 將根據您的更改重新配置 Istio 控制平面。
當新的 Istio 版本可用時,update-istio GitHub Action workflow 工作流將打開一個pull request,其中包含升級 Istio Operator 所需的清單更新。新的 Istio 版本通過 e2e workflow 在 Kubernetes Kind 上進行測試,當 PR 合并到主分支時,Flux 將在集群內升級 Istio。
應用程序引導
當 Flux 將 Git 存儲庫與您的集群同步時,它將創建前端/后端部署(frontend/backend deployment)、HPA 和一個金絲雀對象canary object。Flagger 使用 canary 定義創建了一系列對象:Kubernetes deployments、ClusterIP services、Istio 目標規則(destination rules)和虛擬服務(virtual services)。這些對象在網格(mesh)上公開(expose)應用程序,并推動金絲雀分析(canary analysis)和推廣(promotion)。
- # applied by Flux
- deployment.apps/frontend
- horizontalpodautoscaler.autoscaling/frontend
- canary.flagger.app/frontend
- # generated by Flagger
- deployment.apps/frontend-primary
- horizontalpodautoscaler.autoscaling/frontend-primary
- service/frontend
- service/frontend-canary
- service/frontend-primary
- destinationrule.networking.istio.io/frontend-canary
- destinationrule.networking.istio.io/frontend-primary
- virtualservice.networking.istio.io/frontend
檢查 Flagger 是否成功初始化了金絲雀:
- kubectl -n prod get canaries
- NAME STATUS WEIGHT
- backend Initialized 0
- frontend Initialized 0
當 frontend-primary 部署上線時,Flager 會將所有流量路由到主 Pod,并將 frontend 部署 scale 到零。
使用以下命令查找 Istio 入口網關(ingress gateway)地址:
- kubectl -n istio-system get svc istio-ingressgateway -ojson | jq .status.loadBalancer.ingress
打開瀏覽器并導航到入口地址,您將看到前端 UI。
金絲雀發布
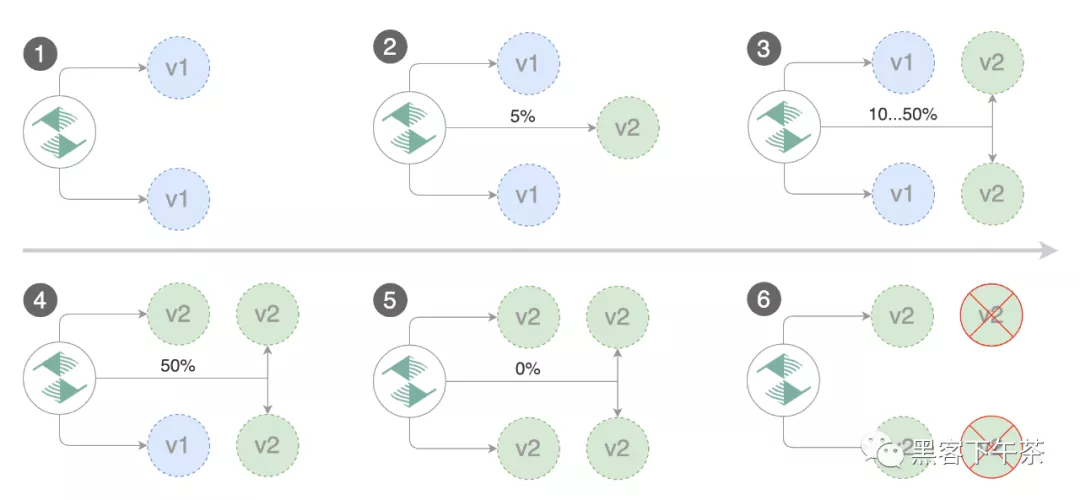
Flagger 實現了一個控制循環,該控制循環在測量關鍵性能指標(如 HTTP 請求成功率、請求平均持續時間和 pod 運行狀況)的同時,逐步將流量轉移到金絲雀。在分析 KPI 的基礎上,將金絲雀升級或中止,并將分析結果發布到 Slack。
金絲雀分析由以下任何對象的更改觸發:
部署 PodSpec(容器鏡像、命令、端口、環境等)
ConfigMaps 和 Secrets 作為卷(volumes)掛載或映射到環境變量
對于不接收恒定流量的工作負載,Flagger 可以配置一個 webhook,當它被調用時,將啟動一個目標工作負載的負載測試。canary 配置可以在 apps/backend/canary.yaml 上找到。
從 GitHub 拉取更改:
- git pull origin main
要觸發后端應用程序的金絲雀部署,請碰撞容器鏡像:
- yq e '.images[0].newTag="5.0.1"' -i ./apps/backend/kustomization.yaml
提交和推送更改:
- git add -A && \
- git commit -m "backend 5.0.1" && \
- git push origin main
告訴 Flux 拉取更改或等待一分鐘讓 Flux 自行檢測更改:
- flux reconcile source git flux-system
觀測 Flux 將您的集群與最新提交進行協調:
- watch flux get kustomizations
幾秒鐘后,Flager 檢測到部署修訂(deployment revision)已更改并開始新的 rollout:
- $ kubectl -n prod describe canary backend
- Events:
- New revision detected! Scaling up backend.prod
- Starting canary analysis for backend.prod
- Pre-rollout check conformance-test passed
- Advance backend.prod canary weight 5
- ...
- Advance backend.prod canary weight 50
- Copying backend.prod template spec to backend-primary.prod
- Promotion completed! Scaling down backend.prod
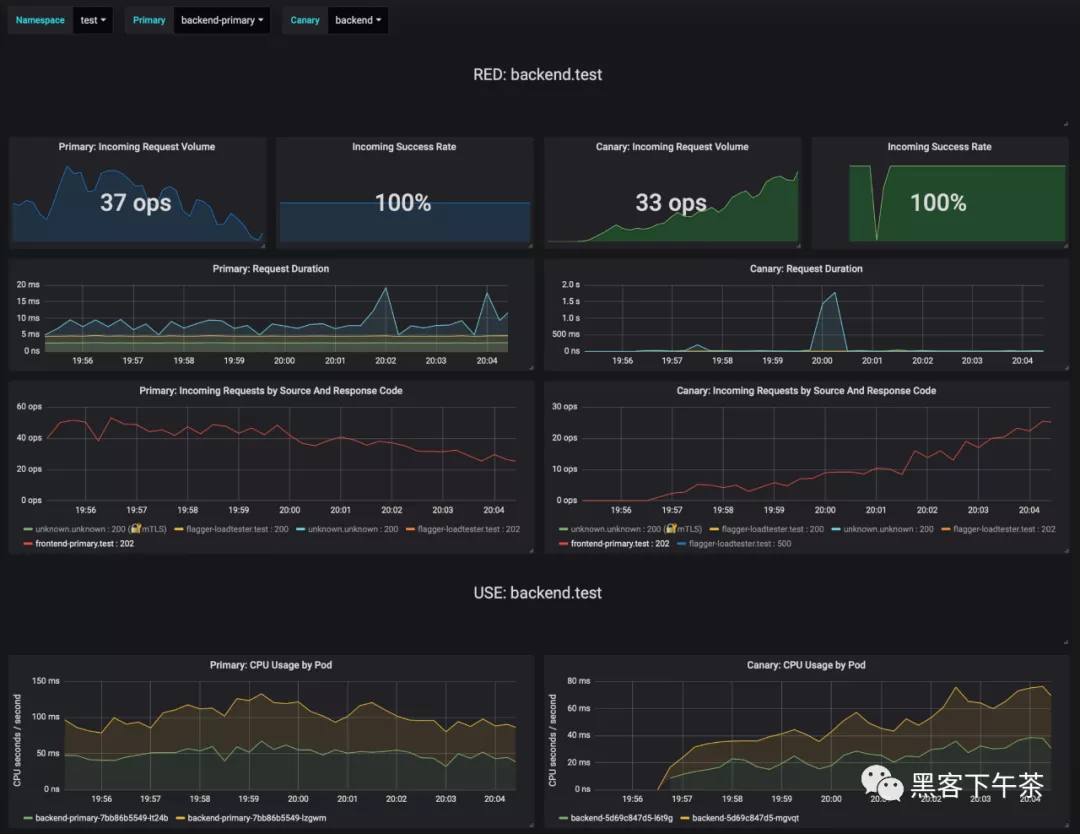
在分析過程中,Grafana 可以監控金絲雀的進程。您可以通過端口轉發訪問儀表板:
- kubectl -n istio-system port-forward svc/flagger-grafana 3000:80
Istio 儀表板的 URL 是 http://localhost:3000/d/flagger-istio/istio-canary?refresh=10s&orgId=1&var-namespace=prod&var-primary=backend-primary&var-canary=backend
請注意,如果在金絲雀分析(canary analysis)期間對部署應用了新的更改,Flagger 將重新啟動分析階段。
A/B 測試
除了加權路由(weighted routing),Flagger 還可以配置為根據 HTTP 匹配條件將流量路由到金絲雀。在 A/B 測試場景中,您將使用 HTTP headers 或 cookie 來定位用戶的特定部分。這對于需要會話(session)關聯的前端應用程序特別有用。
您可以通過指定 HTTP 匹配條件和迭代次數來啟用 A/B 測試:
- analysis:
- # schedule interval (default 60s)
- interval: 10s
- # max number of failed metric checks before rollback
- threshold: 10
- # total number of iterations
- iterations: 12
- # canary match condition
- match:
- - headers:
- user-agent:
- regex: ".*Firefox.*"
- - headers:
- cookie:
- regex: "^(.*?;)?(type=insider)(;.*)?$"
上述配置將針對 Firefox 用戶和擁有內部 cookie 的用戶運行兩分鐘的分析。前端配置可以在 apps/frontend/canary.yaml 中找到。
通過更新前端容器鏡像觸發部署:
- yq e '.images[0].newTag="5.0.1"' -i ./apps/frontend/kustomization.yaml
- git add -A && \
- git commit -m "frontend 5.0.1" && \
- git push origin main
- flux reconcile source git flux-system
Flager 檢測到部署修訂已更改并開始 A/B 測試:
- $ kubectl -n istio-system logs deploy/flagger -f | jq .msg
- New revision detected! Scaling up frontend.prod
- Waiting for frontend.prod rollout to finish: 0 of 1 updated replicas are available
- Pre-rollout check conformance-test passed
- Advance frontend.prod canary iteration 1/10
- ...
- Advance frontend.prod canary iteration 10/10
- Copying frontend.prod template spec to frontend-primary.prod
- Waiting for frontend-primary.prod rollout to finish: 1 of 2 updated replicas are available
- Promotion completed! Scaling down frontend.prod
您可以通過以下方式監控所有金絲雀:
- $ watch kubectl get canaries --all-namespaces
- NAMESPACE NAME STATUS WEIGHT
- prod frontend Progressing 100
- prod backend Succeeded 0
基于 Istio 指標的回滾
Flagger 使用 Istio 遙測提供的指標來驗證金絲雀工作負載。前端應用 analysis 定義了兩個指標檢查:
- metrics:
- - name: error-rate
- templateRef:
- name: error-rate
- namespace: istio-system
- thresholdRange:
- max: 1
- interval: 30s
- - name: latency
- templateRef:
- name: latency
- namespace: istio-system
- thresholdRange:
- max: 500
- interval: 30s
用于檢查錯誤率(error rate)和延遲的 Prometheus 查詢,位于 flagger-metrics.yaml。
在金絲雀分析期間,您可以生成 HTTP 500 errors 和高延遲(high latency)來測試 Flagger 的回滾。
生成 HTTP 500 errors:
- watch curl -b 'type=insider' http://<INGRESS-IP>/status/500
生成延遲:
- watch curl -b 'type=insider' http://<INGRESS-IP>/delay/1
當失敗的檢查次數達到金絲雀分析閾值(threshold)時,流量將路由回主服務器,金絲雀縮放為零,并將推出(rollout)標記為失敗。
- $ kubectl -n istio-system logs deploy/flagger -f | jq .msg
- New revision detected! Scaling up frontend.prod
- Pre-rollout check conformance-test passed
- Advance frontend.prod canary iteration 1/10
- Halt frontend.prod advancement error-rate 31 > 1
- Halt frontend.prod advancement latency 2000 > 500
- ...
- Rolling back frontend.prod failed checks threshold reached 10
- Canary failed! Scaling down frontend.prod
您可以使用針對 Prometheus、Datadog 和 Amazon CloudWatch 的自定義指標檢查來擴展分析。
有關為 Slack、MS Teams、Discord 或 Rocket 配置 canary 分析警報的信息,請參閱文檔。