接口響應慢該如何排查
不知道大家有沒有遇到這種情況,接口業務邏輯寫完后,用 postman 一調,發現接口響應時間好長,不得不對接口進行優化。但是此時接口的代碼往往邏輯比較復雜,調用層次也比較多,很難定位到耗時較長的代碼塊。

遇到這種情況大家都是如何定位耗時代碼塊的呢?
我看到很多人都是直接用System.currentTimeMillis()對代碼進行埋點:
public static void main(String[] args) {
    Long startTime = System.currentTimeMillis();
    exec();
    Long endTime = System.currentTimeMillis();
    log.info("exec 方法執行耗時:{}ms", endTime - startTime);
}
或者用StopWatch打印方法耗時:
public static void main(String[] args) throws InterruptedException {
    StopWatch stopWatch = new StopWatch();
    stopWatch.start("exec");
    exec();
    stopWatch.stop();
    System.out.println(stopWatch.prettyPrint());
}
這兩種方法本質上是一樣的,都是通過手動在代碼塊上進行埋點,打印出方法的耗時,該方法不僅費時費力,而且對代碼有侵入,修復問題后刪掉代碼還是一個麻煩事。
下面介紹如果通過Arthas定位耗時代碼塊。
Arthas 簡介
Arthas是阿里開源的一款 Java 診斷工具,可以在無需重啟 JVM 的情況下,實時查看應用 load、內存、gc、線程等狀態信息,還能實時查看方法調用入參、出參、方法調用耗時等。
Arthas 快速開始
直接下載Arthasjar 包,然后用java -jar命令啟動即可:
$ curl -O https://arthas.aliyun.com/arthas-boot.jar
$ java -jar arthas-boot.jar
Arthas啟動的時候,會打印出當前運行的 java 進程:
$ java -jar arthas-boot.jar
[INFO] JAVA_HOME: /Library/Java/JavaVirtualMachines/jdk1.8.0_351.jdk/Contents/Home/jre
[INFO] arthas-boot version: 3.6.9
[INFO] Found existing java process, please choose one and input the serial number of the process, eg : 1. Then hit ENTER.
* [1]: 12512 com.huangxy.springstudy.SpringStudyApplication
  [2]: 12511 org.jetbrains.jps.cmdline.Launcher
然后可以選擇我們需要 attach 的 java 進程,這里我們選擇 1,然后按回車。Arthas 會 attach 到目標進程上,并輸出日志:
[INFO] arthas home: /Users/huangxiaoyu/.arthas/lib/3.6.9/arthas
[INFO] Try to attach process 12512
[INFO] Attach process 12512 success.
[INFO] arthas-client connect 127.0.0.1 3658
  ,---.  ,------. ,--------.,--.  ,--.  ,---.   ,---.
 /  O  \ |  .--. ''--.  .--'|  '--'  | /  O  \ '   .-'
|  .-.  ||  '--'.'   |  |   |  .--.  ||  .-.  |`.  `-.
|  | |  ||  |\  \    |  |   |  |  |  ||  | |  |.-'    |
`--' `--'`--' '--'   `--'   `--'  `--'`--' `--'`-----'

wiki       https://arthas.aliyun.com/doc
tutorials  https://arthas.aliyun.com/doc/arthas-tutorials.html
version    3.6.9
main_class com.huangxy.springstudy.SpringStudyApplication
pid        12512
time       2023-07-25 09:14:22
到這里,Arthas 已經 attach 到我們的目標進程上了,我們嘗試使用dashboad命令,查看進程的信息:
$ dashboard
ID   NAME                           GROUP          PRIORITY  STATE     %CPU      DELTA_TIME TIME      INTERRUPT DAEMON
36   DestroyJavaVM                  main           5         RUNNABLE  0.0       0.000      0:1.748   false     false
-1   C1 CompilerThread3             -              -1        -         0.0       0.000      0:0.761   false     true
-1   VM Periodic Task Thread        -              -1        -         0.0       0.000      0:0.237   false     true
24   http-nio-8081-exec-1           main           5         WAITING   0.0       0.000      0:0.098   false     true
-1   VM Thread                      -              -1        -         0.0       0.000      0:0.071   false     true
25   http-nio-8081-exec-2           main           5         WAITING   0.0       0.000      0:0.055   false     true
54   arthas-NettyHttpTelnetBootstra system         5         RUNNABLE  0.0       0.000      0:0.054   false     true
-1   GC task thread#8 (ParallelGC)  -              -1        -         0.0       0.000      0:0.043   false     true
-1   GC task thread#1 (ParallelGC)  -              -1        -         0.0       0.000      0:0.043   false     true
-1   GC task thread#7 (ParallelGC)  -              -1        -         0.0       0.000      0:0.042   false     true
-1   GC task thread#6 (ParallelGC)  -              -1        -         0.0       0.000      0:0.042   false     true
-1   GC task thread#0 (ParallelGC)  -              -1        -         0.0       0.000      0:0.042   false     true
-1   GC task thread#9 (ParallelGC)  -              -1        -         0.0       0.000      0:0.042   false     true
-1   GC task thread#2 (ParallelGC)  -              -1        -         0.0       0.000      0:0.042   false     true
-1   GC task thread#3 (ParallelGC)  -              -1        -         0.0       0.000      0:0.042   false     true
-1   GC task thread#5 (ParallelGC)  -              -1        -         0.0       0.000      0:0.042   false     true
-1   GC task thread#4 (ParallelGC)  -              -1        -         0.0       0.000      0:0.042   false     true
Memory                    used     total    max     usage    GC
heap                      83M      432M     7282M   1.14%    gc.ps_scavenge.count           4
ps_eden_space             72M      212M     2688M   2.69%    gc.ps_scavenge.time(ms)        24
ps_survivor_space         0K       21504K   21504K  0.00%    gc.ps_marksweep.count          2
ps_old_gen                10M      199M     5461M   0.20%    gc.ps_marksweep.time(ms)       61
nonheap                   53M      56M      -1      94.71%
code_cache                6M       7M       240M    2.87%
metaspace                 40M      43M      -1      94.45%
compressed_class_space    5M       5M       1024M   0.53%
direct                    16K      16K      -       100.01%
mapped                    0K       0K       -       0.00%
Runtime
os.name                                                      Mac OS X
os.version                                                   13.0.1
java.version                                                 1.8.0_351
java.home                                                    /Library/Java/JavaVirtualMachines/jdk1.8.0_351.jdk/Contents/
                                                             Home/jre
systemload.average                                           3.80
processors                                                   12
可以看到dashboad命令會展示一個實時的數據面板,列出了我們平時比較關心的數據指標,如內存使用量,gc 狀態等。
使用 Trace 命令統計方法耗時
trace命令能主動搜索class-pattern/method-pattern對應的方法調用路徑,渲染和統計整個調用鏈路上的所有性能開銷和追蹤調用鏈路。
比如下面接口:
@RestController
public class HelloController {

    @GetMapping("/test")
    public String test() throws InterruptedException {
       one();
       two();
       return "hello";
    }

    private void two() throws InterruptedException {
        Thread.sleep(20);
        three();
    }

    private void three() throws InterruptedException {
        Thread.sleep(1000);
    }

    private void one() throws InterruptedException {
        Thread.sleep(100);
    }

}
啟動Arthas進程,并 attach 到我們的 springboot 項目上,接著使用trace命令跟蹤方法的調用情況:
$ trace com.huangxy.springstudy.controller.HelloController testtrace方法第一個參數是要 attach 的類的路徑,第二個參數是方法名稱,接著我們調用一遍接口,就能看到 hello 方法的調用堆棧及其耗時
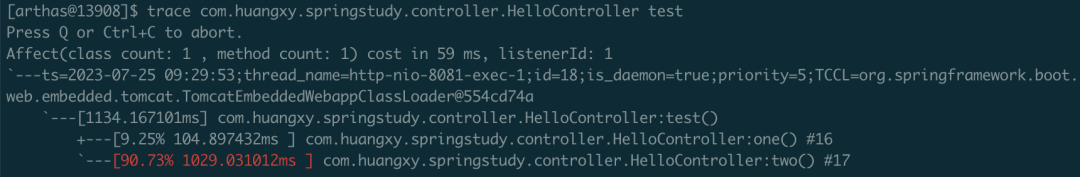
可以看到,這里耗時比較嚴重的是tow()方法,花了 1029ms,占了 90.73% 的比重。
不過需要注意的是,trace 命令只會 trace 匹配到的函數里的子調用,并不會向下 trace 多層,如果需要 trace 多層,可以用正則匹配多個函數,如:
$ trace -E com.huangxy.springstudy.controller.HelloController test|two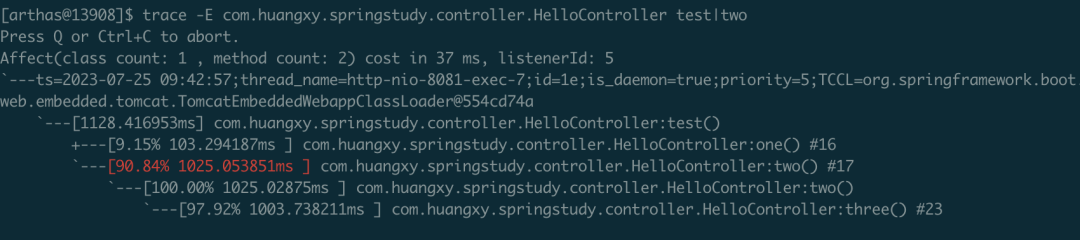
這下更清晰的定位到,導致耗時過長的方法是three()方法,定位到方法后,針對性的優化耗時代碼塊即可。