如何使用 Go 性能工具
在開發過程中,從一開始到應用程序的推出都充滿了挑戰,而負載測試則是其中至關重要的一項工作。這一階段不僅僅是走過場,而是要進行嚴格的評估,確保應用程序的性能符合預期。在測試過程中發現性能不佳或意外瓶頸是常見的障礙,但這也是改進的關鍵時刻。
有了合適的剖析工具,開發人員就能迅速從診斷過渡到有針對性的改進,避免漫無目的的故障排除帶來的隱患。這種簡化的方法不僅節省了寶貴的開發時間,還強調了負載測試和剖析作為追求最佳應用程序性能不可或缺的工具的重要性。
Go 從一開始就配備了出色的工具,幫助開發人員進行負載測試。在參與過使用 Elixir 的項目后,Erlang 中大量的性能測量工具給我留下了深刻印象,而 Go 提供的工具同樣令人印象深刻。本文將探討如何使用這些工具。

一、pprof
pprof 是 Go 專用的剖析器,可輕松確定 CPU 時間用在哪里,內存分配在哪里。獲取配置文件的方法因命令行應用程序和網絡應用程序而異。
1.cpu pprof
對于 CPU 剖析,可在感興趣的代碼段前后調用 pprof.StartCPUProfile() 和 pprof.StopCPUProfile(),并將輸出保存到指定文件(在示例中為 $TMPDIR)。
package main

import (
 "fmt"
 "os"
 "path"
 "runtime/pprof"
)

func main() {
 // Create a file to save the measurement results
 fname := path.Join(os.TempDir(), "cpuprofile.out")
 cpuFile, err := os.Create(fname)

 if err != nil {
  fmt.Println(err)
  return
 }

 // Conduct the measurement pprof.StartCPUProfile(cpuFile)
 defer pprof.StopCPUProfile()

 // Perform a heavy operation
}
執行上述代碼并生成 cpuprofile.out 輸出后,可以將其加載到 pprof 中查看剖析信息。
> go tool pprof /pathtotmpdir/cpuprofile.out
Type: cpu
Time: Dec 17, 2022 at 7:40am (JST)
Duration: 606.44ms, Total samples = 390ms (64.31%)
Entering interactive mode (type "help" for commands, "o" for options)
(pprof)
運行提供的代碼并將輸出加載到 pprof 中,可以檢查配置文件信息。輸入 "top "可顯示十大耗時條目。
(pprof) top
Showing nodes accounting for 390ms, 100% of 390ms total
      flat  flat%   sum%        cum   cum%
     380ms 97.44% 97.44%      390ms   100%  main.Prime (inline)
      10ms  2.56%   100%       10ms  2.56%  runtime.asyncPreempt
         0     0%   100%      390ms   100%  main.main
         0     0%   100%      390ms   100%  runtime.main
(pprof)
-cum選項可檢索每個函數的累計時間。
(pprof) top -cum
Showing nodes accounting for 390ms, 100% of 390ms total
      flat  flat%   sum%        cum   cum%
     380ms 97.44% 97.44%      390ms   100%  main.Prime (inline)
         0     0% 97.44%      390ms   100%  main.main
         0     0% 97.44%      390ms   100%  runtime.main
      10ms  2.56%   100%       10ms  2.56%  runtime.asyncPreempt
(pprof)
list命令顯示了功能的使用時間。
(pprof) list main.Prime
Total: 390ms
ROUTINE ======================== main.Prime in /Users/username/dev/mastering-Go-3rd/ch11/blog/clacpuprofile.go
     380ms      390ms (flat, cum)   100% of Total
         .          .     26:   }
         .          .     27:   fmt.Println("Total primes:", total)
         .          .     28:}
         .          .     29:
         .          .     30:func Prime(n int) bool {
     120ms      130ms     31:   for i := 2; i < n; i++ {
     260ms      260ms     32:           if (n % i) == 0 {
         .          .     33:                   return false
         .          .     34:           }
         .          .     35:   }
         .          .     36:   return true
         .          .     37:}
(pprof)
2.http pprof
對于網絡應用程序,導入 net/http/pprof 會收集可在 /debug/pprof 端點訪問的配置文件信息。
package main
import (
 "net/http"
 "net/http/pprof"
)
func NewHttpServer(addr string) *http.Server {
 httpsrv := newHttpServer()
 r := mux.NewRouter()
 r.HandleFunc("/", httpsrv.handleFoo).Methods("POST")
 r.HandleFunc("/", httpsrv.handleBar).Methods("GET")
 r.HandleFunc("/debug/pprof/", pprof.Index)
 r.HandleFunc("/debug/pprof/cmdline", pprof.Cmdline)
 r.HandleFunc("/debug/pprof/profile", pprof.Profile)
 r.HandleFunc("/debug/pprof/symbol", pprof.Symbol)
 r.HandleFunc("/debug/pprof/trace", pprof.Trace)
 srv := server.NewHttpServer(":8080")
 log.Fatal(srv.ListenAndServe())
}
http pprof 支持與 CPU pprof 類似的配置文件檢查命令,即使在應用程序停止后也能對配置文件進行檢查。
> go tool pprof http://localhost:8080/debug/pprof/profile
Fetching profile over HTTP from http://localhost:8080/debug/pprof/profile
Saved profile in /Users/username/pprof/pprof.samples.cpu.002.pb.gz
Type: cpu
Time: Feb 8, 2023 at 11:12pm (JST)
Duration: 30s, Total samples = 270ms (  0.9%)
Entering interactive mode (type "help" for commands, "o" for options)
(pprof) top
Showing nodes accounting for 270ms, 100% of 270ms total
Showing top 10 nodes out of 67
      flat  flat%   sum%        cum   cum%
      90ms 33.33% 33.33%       90ms 33.33%  syscall.syscall
      80ms 29.63% 62.96%       80ms 29.63%  runtime.pthread_cond_signal
      50ms 18.52% 81.48%       50ms 18.52%  runtime.kevent
      30ms 11.11% 92.59%       30ms 11.11%  runtime.pthread_cond_wait
      20ms  7.41%   100%       20ms  7.41%  syscall.syscall6
         0     0%   100%       10ms  3.70%  bufio.(*Reader).Peek
         0     0%   100%       20ms  7.41%  bufio.(*Reader).ReadLine
         0     0%   100%       20ms  7.41%  bufio.(*Reader).ReadSlice
         0     0%   100%       30ms 11.11%  bufio.(*Reader).fill
         0     0%   100%       30ms 11.11%  bufio.(*Writer).Flush
go tool pprof -http :9402 /Users/username/pprof/pprof.samples.cpu.002.pb.gz在我們的項目中,我們經常通過 k8s 上的端口轉發訪問配置文件信息。
kubectl port-forward -n $namespace localhost 8080:8000
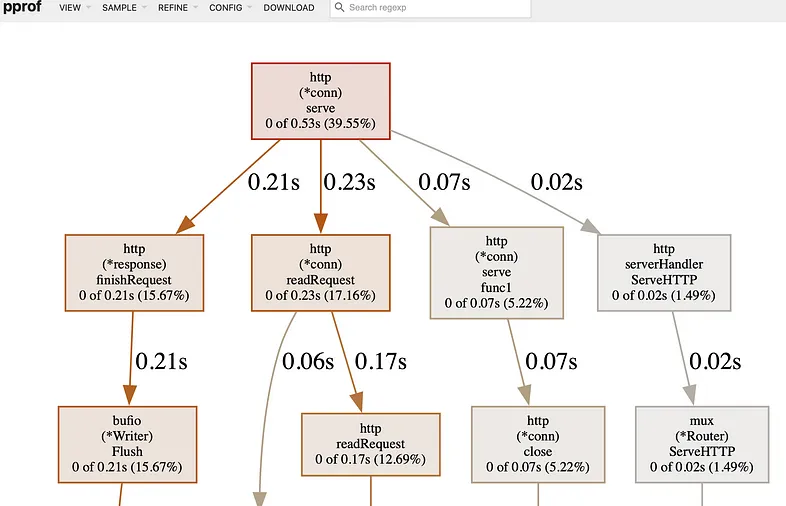
# This allows access at localhost:8000/debug/pprof/profile3.callgraph
除了 CLI 驗證外,您還可以使用 Web 界面在瀏覽器中查看調用圖(這非常棒)。在與之前相同的命令中添加 -http 選項即可。您還可以下載并指定配置文件以供審查。
> go tool pprof -http :8888 http://localhost:8080/debug/pprof/profile
Fetching profile over HTTP from http://localhost:8080/debug/pprof/profile
Saved profile in /Users/username/pprof/pprof.samples.cpu.004.pb.gz
Serving web UI on http://localhost:8888
有了調用圖,您就可以快速了解程序正在調用哪些進程。
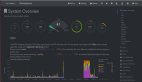
4.火焰圖
火焰圖直觀顯示應用程序花費的時間,可點擊框架深入檢查方法。
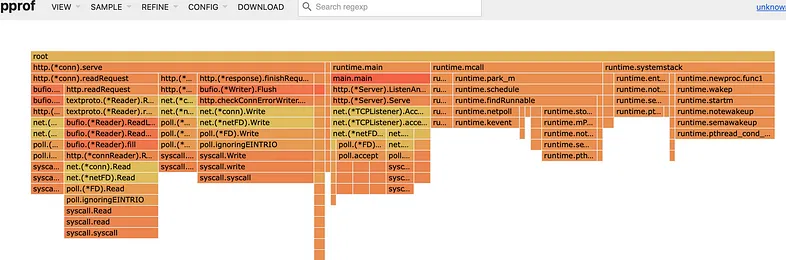
您可以點擊每個幀,進一步檢查方法內部的內容
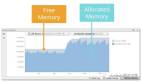
5.檢測內存泄漏
通過比較改進前和改進后的配置文件,大大方便了內存泄漏的檢測,從而方便了泄漏解決方案的識別和驗證。
# before improvement
noglob curl -s http://localhost:8080/debug/pprof/profile > /tmp/profile-before.prof

# after improvement
noglob curl -s http://localhost:8080/debug/pprof/profile > /tmp/profile-after.prof

# Check the difference before and after
go tool pprof -http: 8000 --diff_base /tmp/profile-before.prof /tmp/profile-after.prof
對于內存泄漏調查,可以指定堆配置文件集合。
go tool pprof http://localhost:8080/debug/pprof/heap?seconds=10

# Continue processing for a fixed period before retrieving again
go tool pprof http://localhost:8080/debug/pprof/heap?seconds=10

# Check the difference (can also be viewed in the web interface with the -http option)
go tool pprof --diff_base=/Users/username/pprof/pprof.alloc_objects.alloc_space.inuse_objects.inuse_space.001.pb.gz /Users/username/pprof/pprof.alloc_objects.alloc_space.inuse_objects.inuse_space.002.pb.gz

(pprof) top
Showing nodes accounting for 12.92GB, 295.37% of 4.38GB total
Dropped 2 nodes (cum <= 0.02GB)
      flat  flat%   sum%        cum   cum%
   12.92GB 295.37% 295.37%    12.93GB 295.56%  main.main
         0     0% 295.37%    12.93GB 295.56%  runtime.main
(pprof) top 20
Showing nodes accounting for 12.92GB, 295.37% of 4.38GB total
Dropped 2 nodes (cum <= 0.02GB)
      flat  flat%   sum%        cum   cum%
   12.92GB 295.37% 295.37%    12.93GB 295.56%  main.main
         0     0% 295.37%    12.93GB 295.56%  runtime.main
(pprof) list main.
Total: 4.38GB
ROUTINE ======================== main.main in /Users/username/dev/proglog/cmd/server/main.go
   12.92GB    12.93GB (flat, cum) 295.56% of Total
         .          .     15:
二、trace
trace 可讓用戶深入了解運行時如何調度 goroutine,為調查爭用問題或 GC 問題提供有關堆、操作系統線程數和 goroutine 狀態的寶貴數據。在命令行應用程序中可通過 runtime/trace 軟件包訪問,在網絡應用程序中可通過 net/http 軟件包訪問。
# fetch trace with executing web application
noglob curl http://localhost:8080/debug/pprof/trace?seconds=10 > /tmp/pprof.trace
# chech the trace
go tool trace /tmp/pprof.trace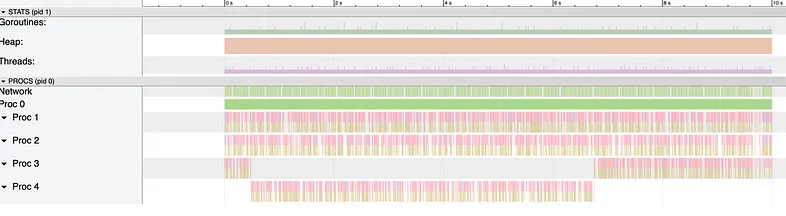
總結
總而言之,從開發到部署的整個過程都離不開基本的負載測試和性能剖析。利用 Go 的 pprof 和跟蹤工具,開發人員可以深入了解性能瓶頸、CPU 使用率和內存分配情況。
可視化調用圖和火焰圖的功能進一步幫助找出效率低下的問題,從而進行精確的優化。利用這些工具不僅能加強調試過程,還能顯著提高應用程序的性能。采用這些方法對于確保我們的應用程序穩健高效、隨時滿足實際需求至關重要。