通過Prometheus來做SLI/SLO監控展示
什么是SLI/SLO
SLI,全名Service Level Indicator,是服務等級指標的簡稱,它是衡定系統穩定性的指標。
SLO,全名Sevice Level Objective,是服務等級目標的簡稱,也就是我們設定的穩定性目標,比如"4個9","5個9"等。
SRE通常通過這兩個指標來衡量系統的穩定性,其主要思路就是通過SLI來判斷SLO,也就是通過一系列的指標來衡量我們的目標是否達到了"幾個9"。
如何選擇SLI
在系統中,常見的指標有很多種,比如:
- 系統層面:CPU使用率、內存使用率、磁盤使用率等
- 應用服務器層面:端口存活狀態、JVM的狀態等
- 應用運行層面:狀態碼、時延、QPS等
- 中間件層面:QPS、TPS、時延等
- 業務層面:成功率、增長速度等
這么多指標,應該如何選擇呢?只要遵從兩個原則就可以:
- 選擇能夠標識一個主體是否穩定的指標,如果不是這個主體本身的指標,或者不能標識主體穩定性的,就要排除在外。
- 優先選擇與用戶體驗強相關或用戶可以明顯感知的指標。
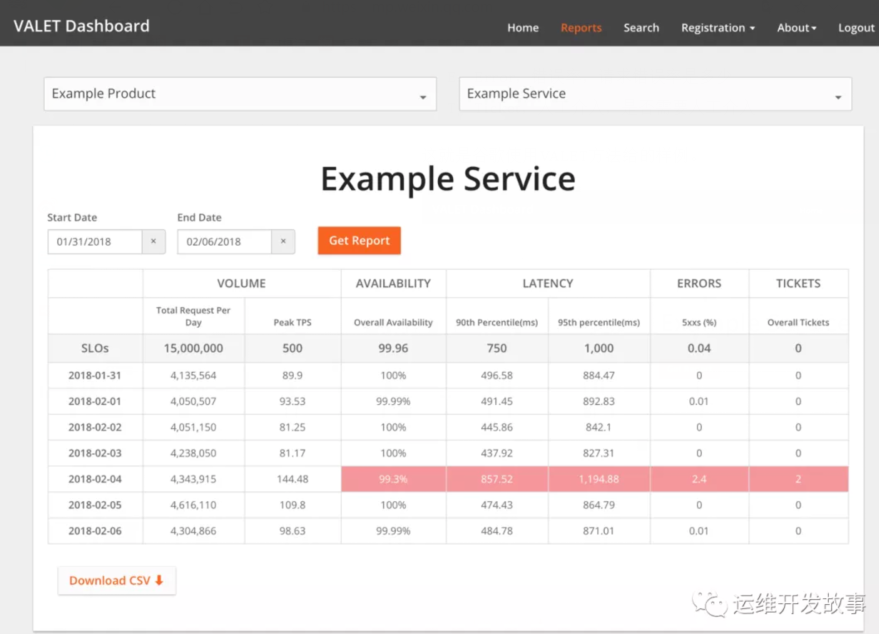
通常情況下,可以直接使用谷歌的VALET指標方法。
- V:Volume,容量,服務承諾的最大容量
- A:Availability,可用性,服務是否正常
- L:Latency,延遲,服務的響應時間
- E:Error,錯誤率,請求錯誤率是多少
- T:Ticket,人工介入,是否需要人工介入
這就是谷歌使用VALET方法給的樣例。
上面僅僅是簡單的介紹了一下SLI/SLO,更多的知識可以學習《SRE:Google運維解密》和趙成老師的極客時間課程《SRE實踐手冊》。下面來簡單介紹如何使用Prometheus來進行SLI/SLO監控。
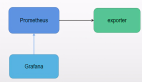
service-level-operator
Service level operator是為了Kubernetes中的應用SLI/SLO指標來衡量應用的服務指標,并可以通過Grafana來進行展示。
Operator主要是通過SLO來查看和創建新的指標。例如:
- apiVersion: monitoring.spotahome.com/v1alpha1
- kind: ServiceLevel
- metadata:
- name: awesome-service
- spec:
- serviceLevelObjectives:
- - name: "9999_http_request_lt_500"
- description: 99.99% of requests must be served with <500 status code.
- disable: false
- availabilityObjectivePercent: 99.99
- serviceLevelIndicator:
- prometheus:
- address: http://myprometheus:9090
- totalQuery: sum(increase(http_request_total{host="awesome_service_io"}[2m]))
- errorQuery: sum(increase(http_request_total{host="awesome_service_io", code=~"5.."}[2m]))
- output:
- prometheus:
- labels:
- team: a-team
- iteration: "3"
- availabilityObjectivePercent:SLO
- totalQuery:總請求數
- errorQuery:錯誤請求數
Operator通過totalQuert和errorQuery就可以計算出SLO的指標了。
部署service-level-operator
- 前提:在Kubernetes集群中部署好Prometheus,我這里是采用Prometheus-Operator方式進行部署的。
(1)首先創建RBAC
- apiVersion: v1
- kind: ServiceAccount
- metadata:
- name: service-level-operator
- namespace: monitoring
- labels:
- app: service-level-operator
- component: app
- ---
- apiVersion: rbac.authorization.k8s.io/v1
- kind: ClusterRole
- metadata:
- name: service-level-operator
- labels:
- app: service-level-operator
- component: app
- rules:
- # Register and check CRDs.
- - apiGroups:
- - apiextensions.k8s.io
- resources:
- - customresourcedefinitions
- verbs:
- - "*"
- # Operator logic.
- - apiGroups:
- - monitoring.spotahome.com
- resources:
- - servicelevels
- - servicelevels/status
- verbs:
- - "*"
- ---
- kind: ClusterRoleBinding
- apiVersion: rbac.authorization.k8s.io/v1
- metadata:
- name: service-level-operator
- subjects:
- - kind: ServiceAccount
- name: service-level-operator
- namespace: monitoring
- roleRef:
- apiGroup: rbac.authorization.k8s.io
- kind: ClusterRole
- name: service-level-operator
(2)然后創建Deployment
- apiVersion: apps/v1
- kind: Deployment
- metadata:
- name: service-level-operator
- namespace: monitoring
- labels:
- app: service-level-operator
- component: app
- spec:
- replicas: 1
- selector:
- matchLabels:
- app: service-level-operator
- component: app
- strategy:
- rollingUpdate:
- maxUnavailable: 0
- template:
- metadata:
- labels:
- app: service-level-operator
- component: app
- spec:
- serviceAccountName: service-level-operator
- containers:
- - name: app
- imagePullPolicy: Always
- image: quay.io/spotahome/service-level-operator:latest
- ports:
- - containerPort: 8080
- name: http
- protocol: TCP
- readinessProbe:
- httpGet:
- path: /healthz/ready
- port: http
- livenessProbe:
- httpGet:
- path: /healthz/live
- port: http
- resources:
- limits:
- cpu: 220m
- memory: 254Mi
- requests:
- cpu: 120m
- memory: 128Mi
(3)創建service
- apiVersion: v1
- kind: Service
- metadata:
- name: service-level-operator
- namespace: monitoring
- labels:
- app: service-level-operator
- component: app
- spec:
- ports:
- - port: 80
- protocol: TCP
- name: http
- targetPort: http
- selector:
- app: service-level-operator
- component: app
(4)創建prometheus serviceMonitor
- apiVersion: monitoring.coreos.com/v1
- kind: ServiceMonitor
- metadata:
- name: service-level-operator
- namespace: monitoring
- labels:
- app: service-level-operator
- component: app
- prometheus: myprometheus
- spec:
- selector:
- matchLabels:
- app: service-level-operator
- component: app
- namespaceSelector:
- matchNames:
- - monitoring
- endpoints:
- - port: http
- interval: 10s
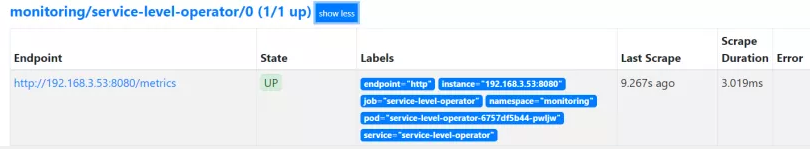
到這里,Service Level Operator部署完成了,可以在prometheus上查看到對應的Target,如下:
然后就需要創建對應的服務指標了,如下所示創建一個示例。
- apiVersion: monitoring.spotahome.com/v1alpha1
- kind: ServiceLevel
- metadata:
- name: prometheus-grafana-service
- namespace: monitoring
- spec:
- serviceLevelObjectives:
- - name: "9999_http_request_lt_500"
- description: 99.99% of requests must be served with <500 status code.
- disable: false
- availabilityObjectivePercent: 99.99
- serviceLevelIndicator:
- prometheus:
- address: http://prometheus-k8s.monitoring.svc:9090
- totalQuery: sum(increase(http_request_total{service="grafana"}[2m]))
- errorQuery: sum(increase(http_request_total{service="grafana", code=~"5.."}[2m]))
- output:
- prometheus:
- labels:
- team: prometheus-grafana
- iteration: "3"
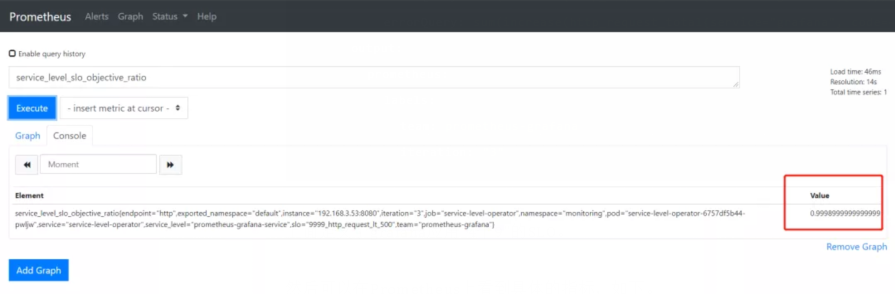
上面定義了grafana應用"4個9"的SLO。
然后可以在Prometheus上看到具體的指標,如下。
接下來在Grafana上導入ID為8793的Dashboard,即可生成如下圖表。
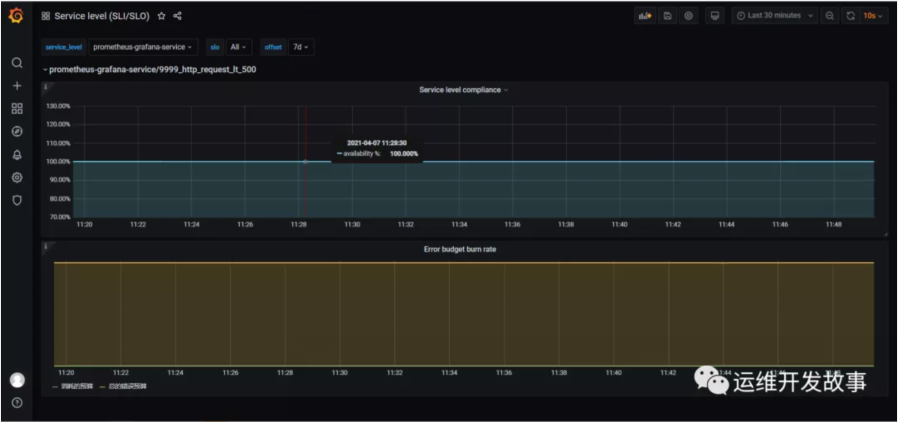
上面是SLI,下面是錯誤總預算和已消耗的錯誤。
下面可以定義告警規則,當SLO下降時可以第一時間收到,比如:
- groups:
- - name: slo.rules
- rules:
- - alert: SLOErrorRateTooFast1h
- expr: |
- (
- increase(service_level_sli_result_error_ratio_total[1h])
- /
- increase(service_level_sli_result_count_total[1h])
- ) > (1 - service_level_slo_objective_ratio) * 14.6
- labels:
- severity: critical
- team: a-team
- annotations:
- summary: The monthly SLO error budget consumed for 1h is greater than 2%
- description: The error rate for 1h in the {{$labels.service_level}}/{{$labels.slo}} SLO error budget is being consumed too fast, is greater than 2% monthly budget.
- - alert: SLOErrorRateTooFast6h
- expr: |
- (
- increase(service_level_sli_result_error_ratio_total[6h])
- /
- increase(service_level_sli_result_count_total[6h])
- ) > (1 - service_level_slo_objective_ratio) * 6
- labels:
- severity: critical
- team: a-team
- annotations:
- summary: The monthly SLO error budget consumed for 6h is greater than 5%
- description: The error rate for 6h in the {{$labels.service_level}}/{{$labels.slo}} SLO error budget is being consumed too fast, is greater than 5% monthly budget.
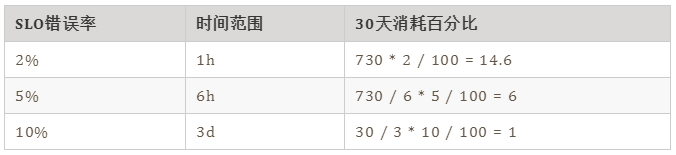
第一條規則表示在1h內消耗的錯誤率大于30天內的2%,應該告警。第二條規則是在6h內的錯誤率大于30天的5%,應該告警。
下面是谷歌的的基準。
最后
說到系統穩定性,這里不得不提到系統可用性,SRE提高系統的穩定性,最終還是為了提升系統的可用時間,減少故障時間。那如何來衡量系統的可用性呢?
目前業界有兩種衡量系統可用性的方式,一個是時間維度,一個是請求維度。時間維度就是從故障出發對系統的穩定性進行評估。請求維度是從成功請求占比的角度出發,對系統穩定性進行評估。
時間維度:可用性 = 服務時間 / (服務時間 + 故障時間)
請求維度:可用性 = 成功請求數 / 總請求數
在SRE實踐中,通常會選擇請求維度來衡量系統的穩定性,就如上面的例子。不過,如果僅僅通過一個維度來判斷系統的穩定性也有點太武斷,還應該結合更多的指標,比如延遲,錯誤率等,而且對核心應用,核心鏈路的SLI應該更細致。
參考
[1] 《SRE實踐手冊》- 趙成
[2] 《SRE:Google運維解密》
[3] https://github.com/spotahome/service-level-operator