快速學習一個算法,CNN
大家好,我是小寒
今天給大家介紹一個強大的算法模型,CNN
卷積神經網絡 (CNN) 是一類深度學習算法,主要用于處理和分析視覺數據。
它們徹底改變了計算機視覺領域,使圖像識別、物體檢測和各種其他應用取得了突破。
什么是卷積神經網絡?
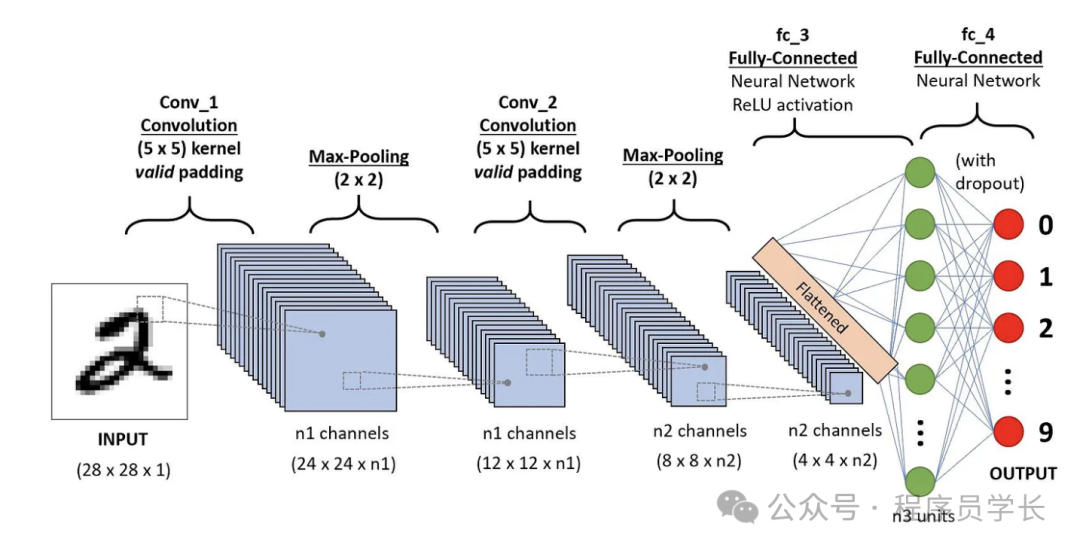
卷積神經網絡 (CNN) 是一種人工神經網絡,專門用于處理結構化網格數據(例如圖像)。
與將輸入視為平面像素陣列的傳統神經網絡不同,CNN 利用圖像的空間結構來提取分層特征。這種能力使 CNN 在圖像分類、對象檢測和分割等任務中特別有效。
 圖片
圖片
關鍵組件
1.卷積層
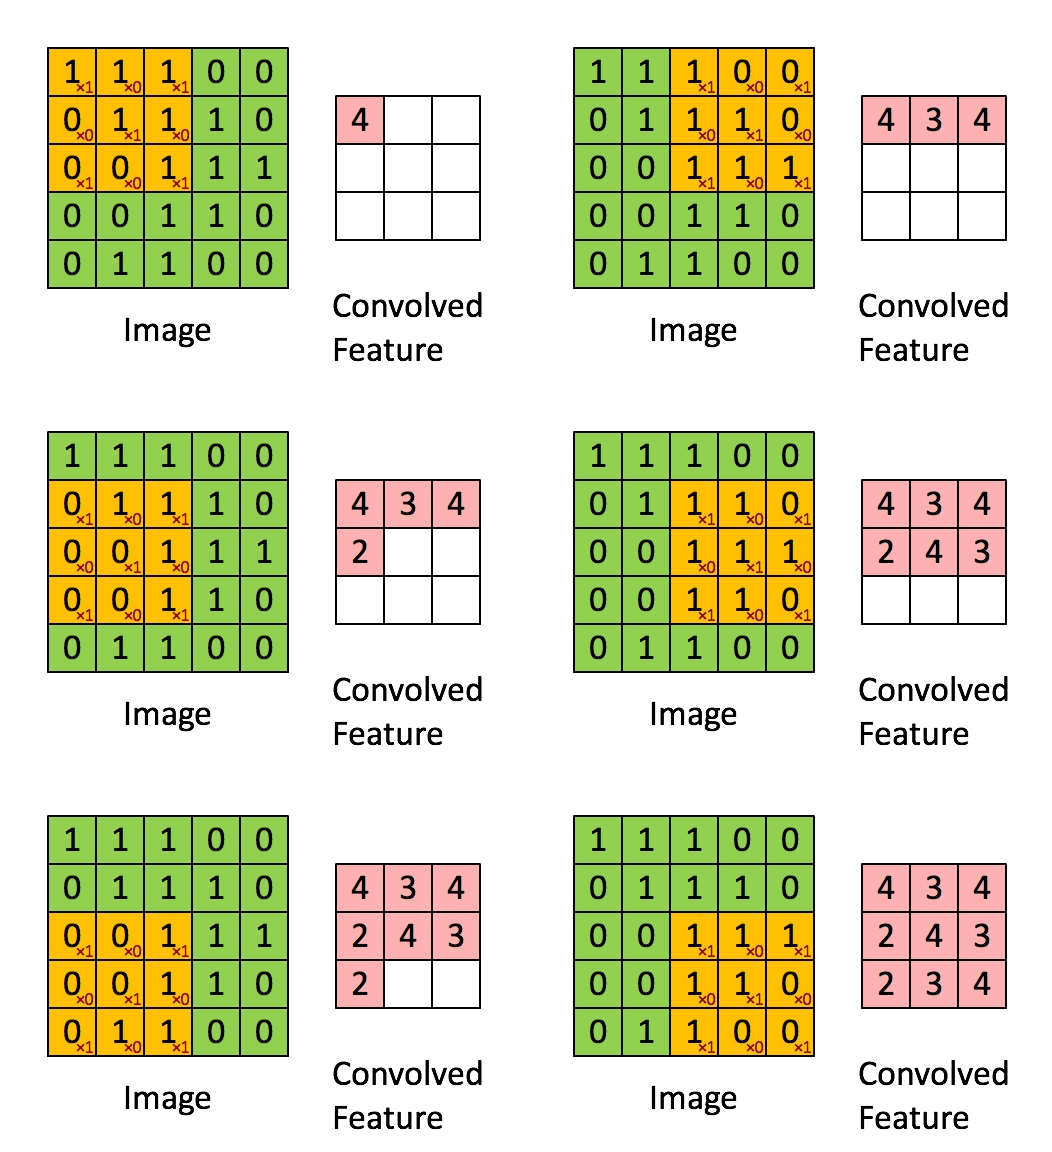
卷積層是 CNN 的核心組件,用于提取輸入數據的特征。
卷積層通過濾波器(卷積核)在輸入數據上滑動,進行卷積操作,生成特征圖(Feature Map)。每個卷積核負責捕捉圖像的不同特征,如邊緣、紋理等。
 圖片
圖片
- 卷積核
檢測特定特征(如邊緣、紋理或圖案)的小矩陣。常見尺寸為 3x3 或 5x5。 - 步幅
卷積核在輸入圖像上移動的步長。步幅為 1 表示卷積核每次移動一個像素。 - 填充
在輸入圖像的邊框周圍添加額外的像素,以確保卷積核正確適配。
 圖片
圖片
以下是使用 NumPy 的簡單實現。
import numpy as np

def convolve(image, kernel, stride=1, padding=0):
    # Add padding to the input image
    image_padded = np.pad(image, [(padding, padding), (padding, padding)], mode='constant', constant_values=0)

    # Calculate output dimensions
    output_height = (image.shape[0] - kernel.shape[0] + 2 * padding) // stride + 1
    output_width = (image.shape[1] - kernel.shape[1] + 2 * padding) // stride + 1

    # Initialize output
    output = np.zeros((output_height, output_width))

    # Perform convolution
    for i in range(0, output_height, stride):
        for j in range(0, output_width, stride):
            output[i, j] = np.sum(image_padded[i:i+kernel.shape[0], j:j+kernel.shape[1]] * kernel)

    return output
2.池化層
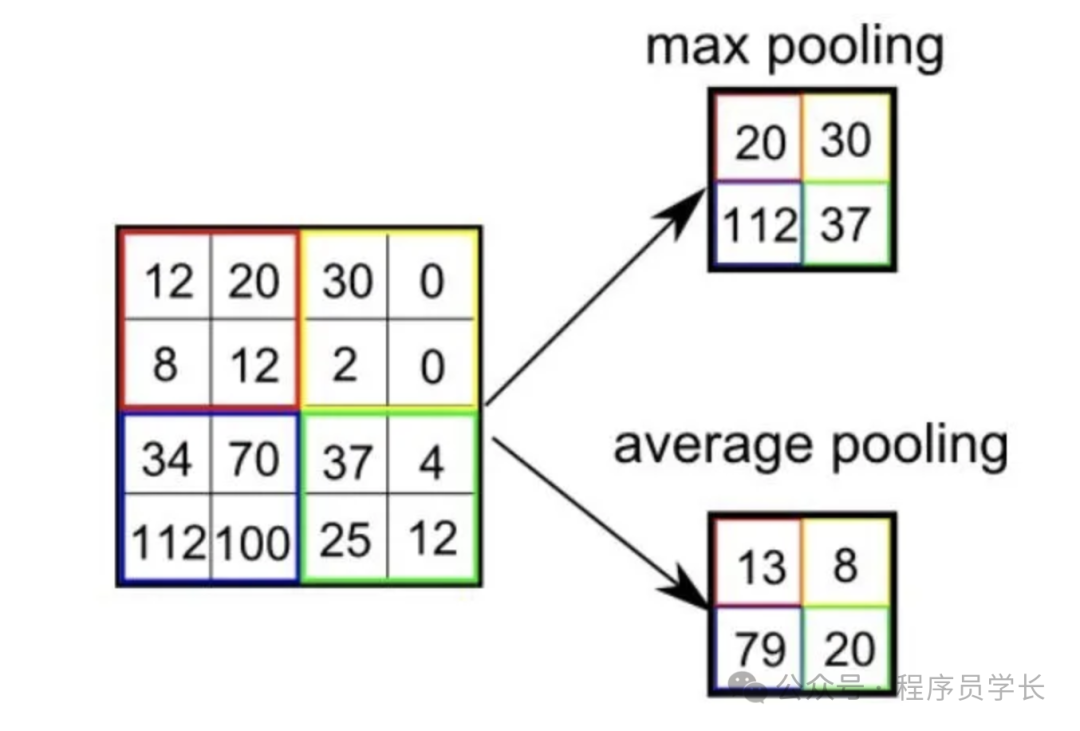
池化層通常用于降低特征圖的空間尺寸(高度和寬度),減少參數數量和計算復雜性,同時使特征檢測更加魯棒。
池化操作主要有兩種類型:
- 最大池化:從特征圖的每個塊中獲取最大值。
- 平均池化:從特征圖的每個塊中取平均值。
 圖片
圖片
def max_pooling(image, size=2, stride=2):
    output_height = (image.shape[0] - size) // stride + 1
    output_width = (image.shape[1] - size) // stride + 1
    output = np.zeros((output_height, output_width))

    for i in range(0, output_height, stride):
        for j in range(0, output_width, stride):
            output[i, j] = np.max(image[i:i+size, j:j+size])

    return output
3.全連接層
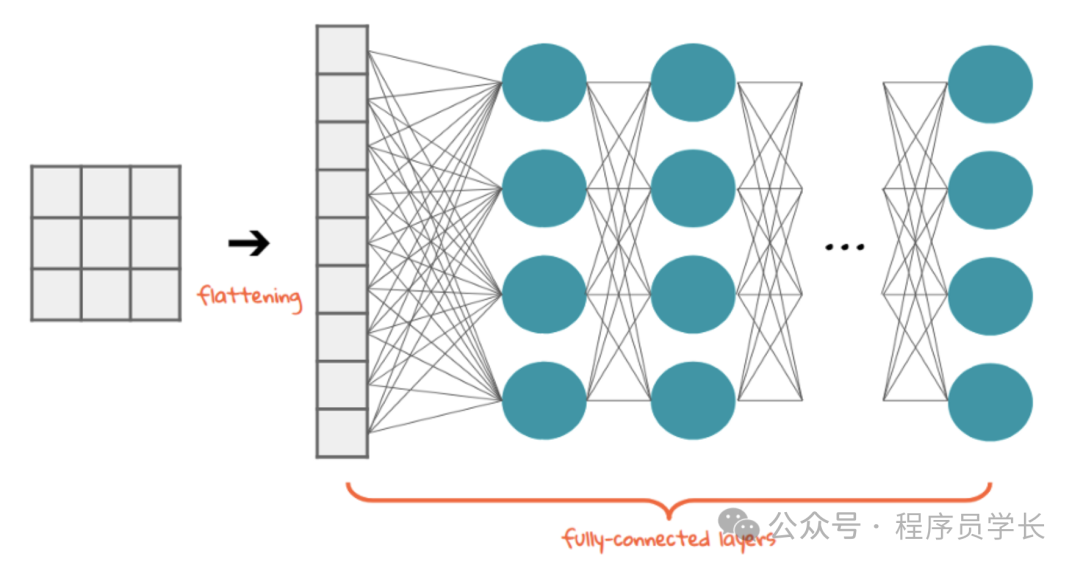
經過幾個卷積層和池化層之后,神經網絡中的高級推理通過全連接層完成。
這些層將扁平化的特征圖作為輸入,并將其用于最終分類。
 圖片
圖片
CNN 的執行過程
讓我們通過一個例子來了解 CNN 如何處理圖像:
- 輸入圖像
考慮 32x32x3 RGB 圖像(高度、寬度、深度)。 - 卷積層
對圖像應用多個過濾器(例如 3x3),從而產生多個特征圖。假設我們使用 10 個過濾器;輸出將為 32x32x10。 - 池化層
使用 2x2 最大池化,步長為 2,以減少空間維度。輸出將為 16x16x10。 - 額外的卷積和池化層
根據需要重復卷積、激活和池化操作。 - 全連接層
將最后一個池化層的輸出展平(例如,8x8x10 變為 640 維向量)并將其連接到密集層以進行分類。 - 輸出層
應用softmax函數獲取類別的概率分布。
下面我們將使用 TensorFlow 構建一個簡單的 CNN,用于 MNIST 數據集(手寫數字數據集)的圖像分類。
首先我們導入必要的庫
import tensorflow as tf
from tensorflow.keras import layers, models
import matplotlib.pyplot as plt
然后加載和預處理數據
# Load the MNIST dataset
(train_images, train_labels), (test_images, test_labels) = tf.keras.datasets.mnist.load_data()

# Normalize the images
train_images = train_images.reshape((60000, 28, 28, 1)).astype('float32') / 255
test_images = test_images.reshape((10000, 28, 28, 1)).astype('float32') / 255
構建 CNN 模型
model = models.Sequential([
    layers.Conv2D(32, (3, 3), activatinotallow='relu', input_shape=(28, 28, 1)),
    layers.MaxPooling2D((2, 2)),
    layers.Conv2D(64, (3, 3), activatinotallow='relu'),
    layers.MaxPooling2D((2, 2)),
    layers.Conv2D(64, (3, 3), activatinotallow='relu'),
    layers.Flatten(),
    layers.Dense(64, activatinotallow='relu'),
    layers.Dense(10, activatinotallow='softmax')
])
model.summary()
編譯并訓練模型
model.compile(optimizer='adam',
              loss='sparse_categorical_crossentropy',
              metrics=['accuracy'])
history = model.fit(train_images, train_labels, epochs=5,
                    validation_data=(test_images, test_labels))
評估模型
test_loss, test_acc = model.evaluate(test_images, test_labels)
print(f"Test accuracy: {test_acc}")
plt.plot(history.history['accuracy'], label='accuracy')
plt.plot(history.history['val_accuracy'], label='val_accuracy')
plt.xlabel('Epoch')
plt.ylabel('Accuracy')
plt.legend(loc='lower right')
plt.show()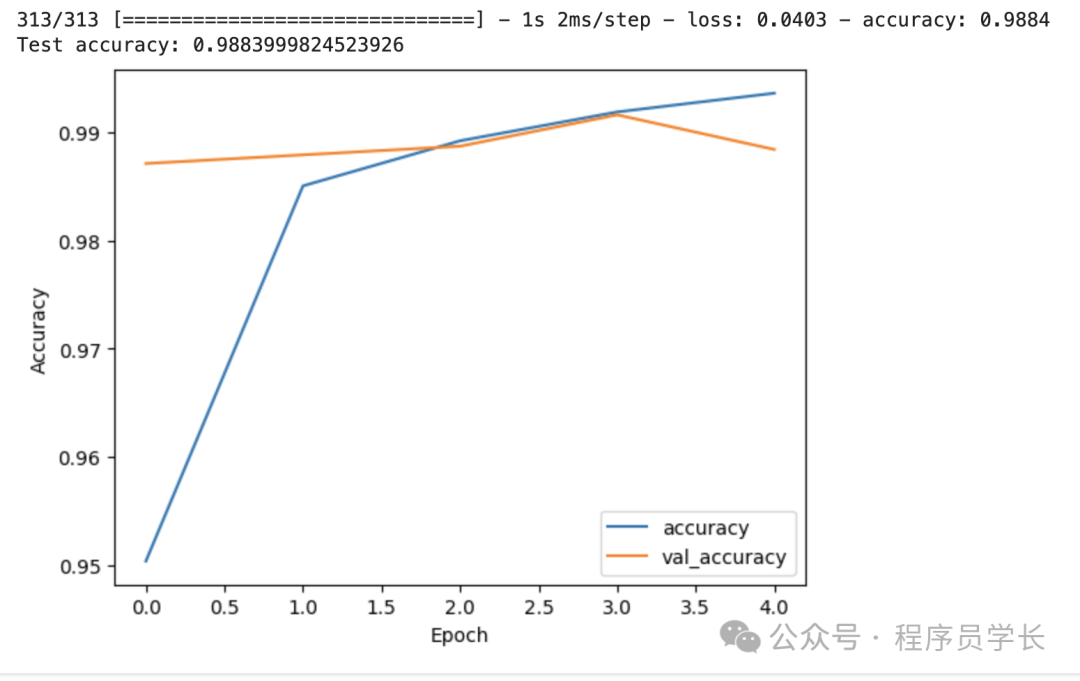 圖片
圖片


