微軟開源Markdown工具爆了:支持Office文檔,可接多模態LLM直出報告
微軟官方開源了一款文件格式轉換工具——MarkItDown!
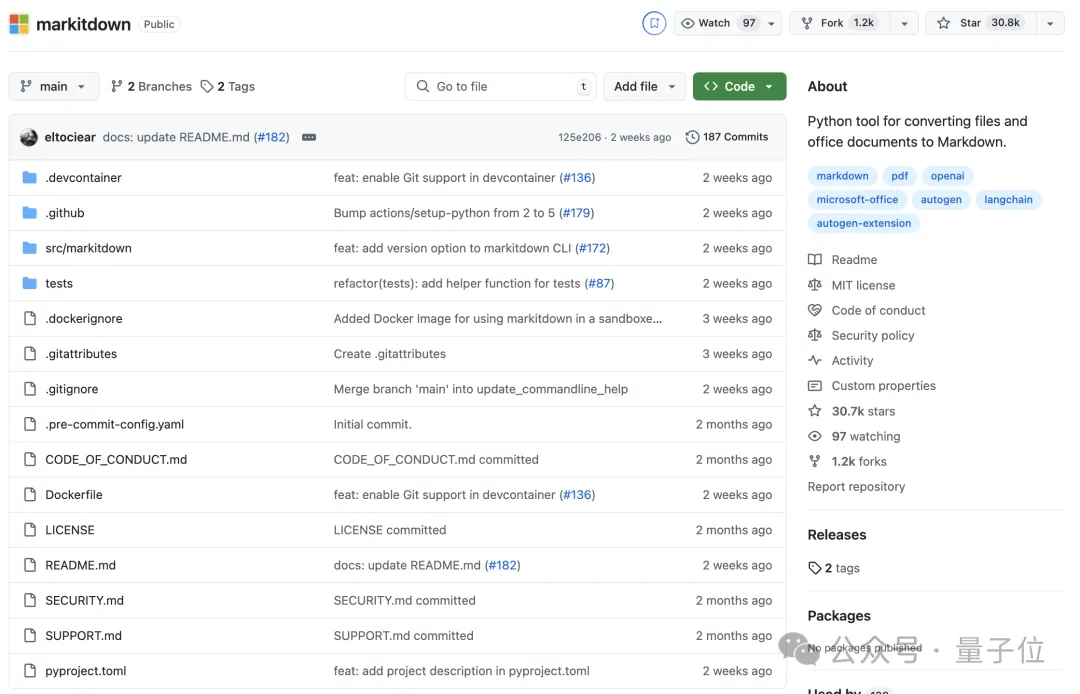
它不僅可以將常見的Office文檔(Word、PowerPoint、Excel)、PDF、圖像、音頻等轉換為對大模型更友好的Markdown格式。
而且還支持集成像GPT-4o這樣的多模態LLM,可以直接對圖片、音頻文件進行更高級的處理,比如快速輸出商業報告。
以后開發者們上傳訓練數據、微調LLM應用都更方便了。
發布僅兩個月,它的GitHub收藏數就超過了3萬。

具體來說,它支持的文件格式包括:
- PowerPoint
- Word
- Excel
- 圖像(含OCR和EXIF元數據)
- 音頻(含EXIF元數據和轉錄)
- HTML
- 其他基于文本的格式(CSV, JSON, XML)
- 壓縮包
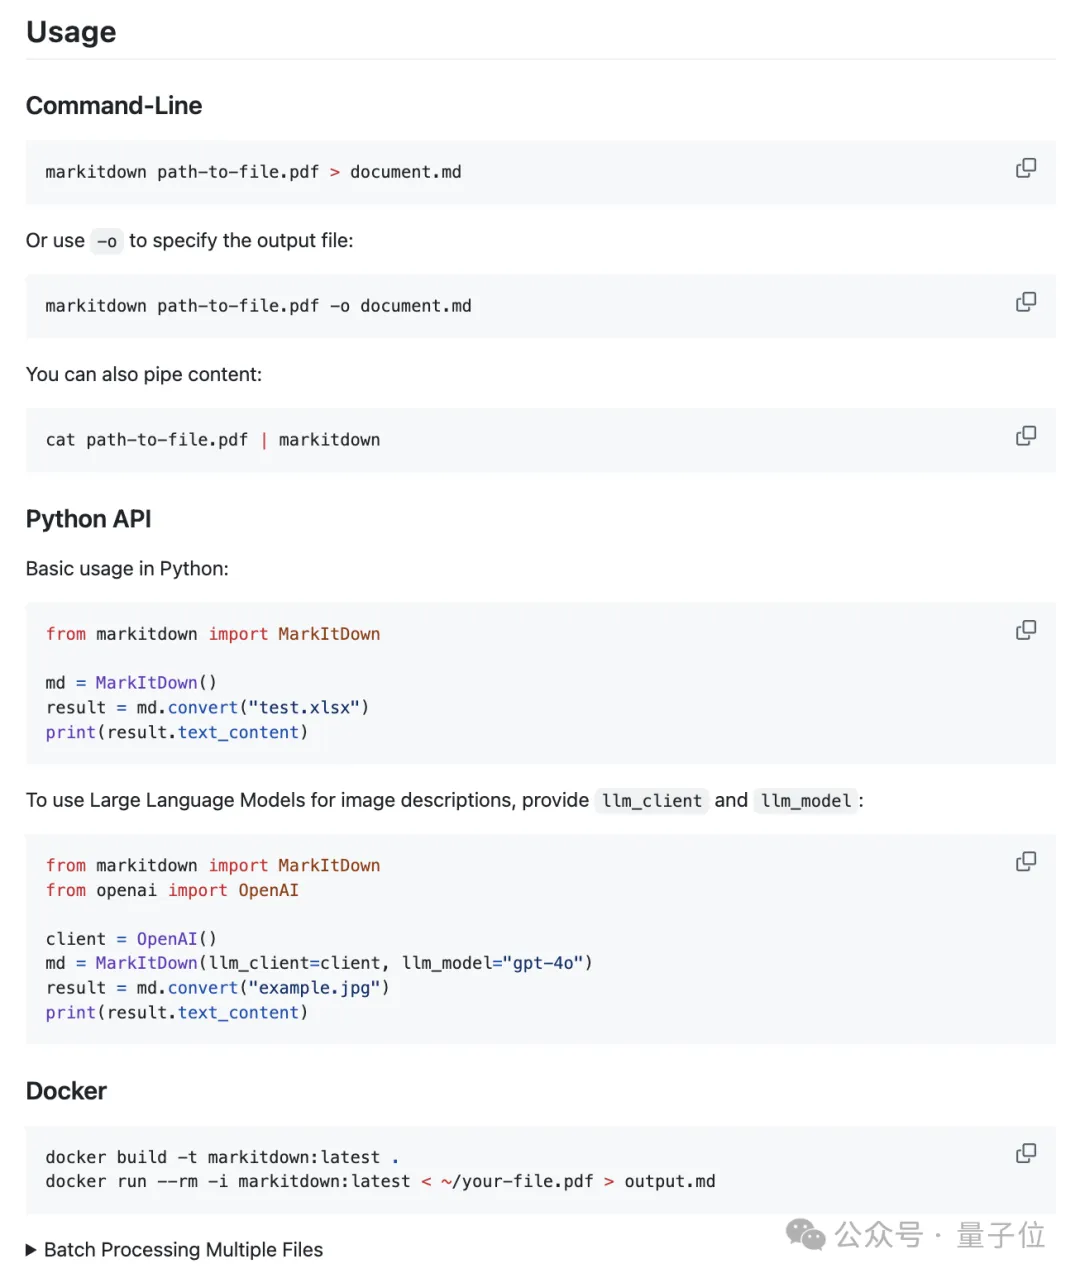
使用方式上,MarkItDown提供了命令行、Python API以及Docker三種形式。
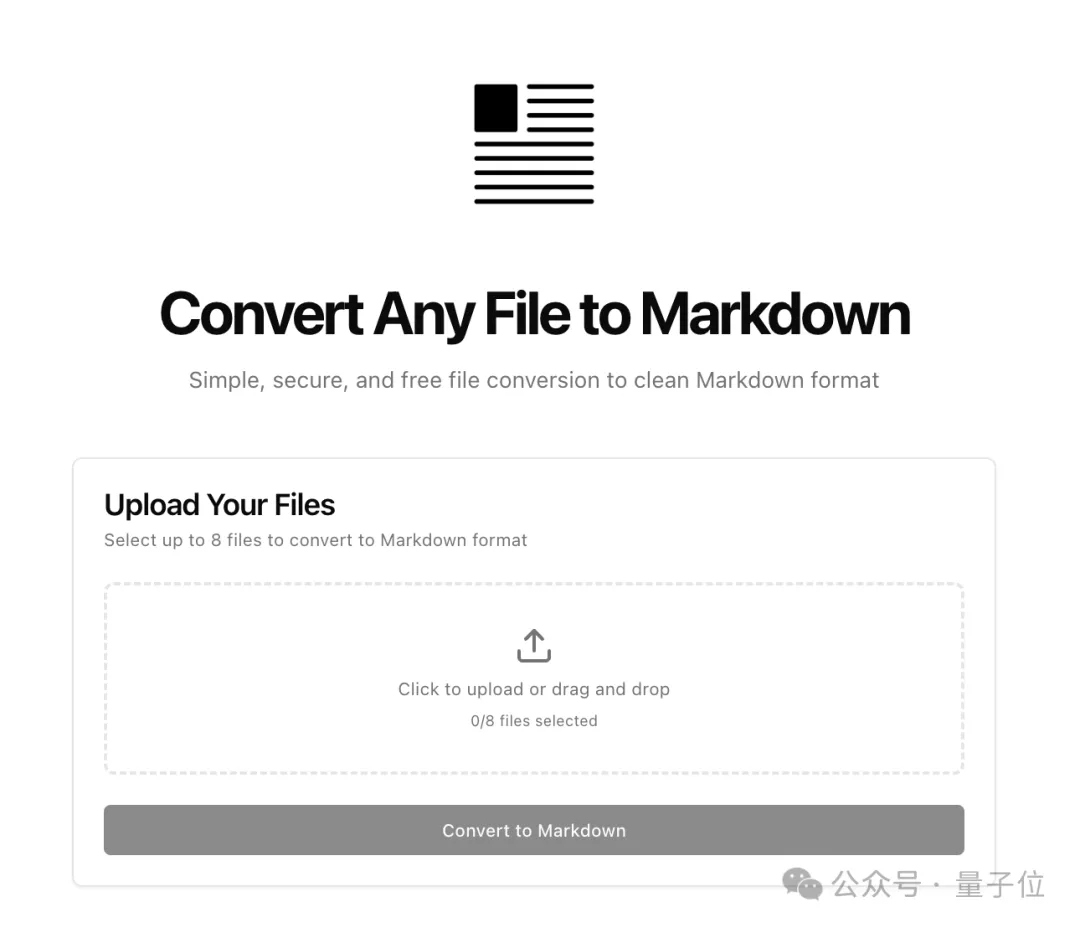
熱心網友Aark Kodur還制作了在線版的網頁應用,點開網址就能直接試用。
可接多模態LLM直接生成報告
哥倫比亞大學講師Tharsis用一個證券報告分析任務測試了MarkItDown的性能,同時也將它與IBM的熱門Markdown轉換庫Docling進行了對比,一起來看看吧。
首先看看兩個庫的基本信息。
MarkItDown是由微軟AutoGen團隊開發的Python包和CLI,用于將各種文件格式轉換為Markdown。
它支持包括PDF、PowerPoint、Word、Excel、圖像(含 OCR 和 EXIF 元數據)、音頻(含轉錄)、HTML以及其他基于文本的格式,是文檔索引和構建基于LLM應用程序的有用工具。
主要特點:
- 簡單命令行和Python API接口
- 支持多種文件格式
- 可集成LLM增強圖像描述
- 支持批處理能力
- 支持Docker容器化使用
使用示例:
from markitdown import MarkItDown

md = MarkItDown()
result = md.convert("test.xlsx")
print(result.text_content)
Docling是由IBM研究院開發的Python包,用于解析和將文檔轉換為各種格式。
它提供高級文檔理解能力,重點在于保持文檔結構和格式。
主要特點:
- 支持多種文檔格式(PDF、DOCX、PPTX、XLSX、圖片、HTML 等)
- 高級PDF解析,包括布局分析和表格提取
- 統一的文檔表示格式
- 集成LlamaIndex和LangChain
- 支持OCR分析掃描文檔
- 簡單命令行界面
使用示例:
from docling.document_converter import DocumentConverter

converter = DocumentConverter()
result = converter.convert("document.pdf")
print(result.document.export_to_markdown())
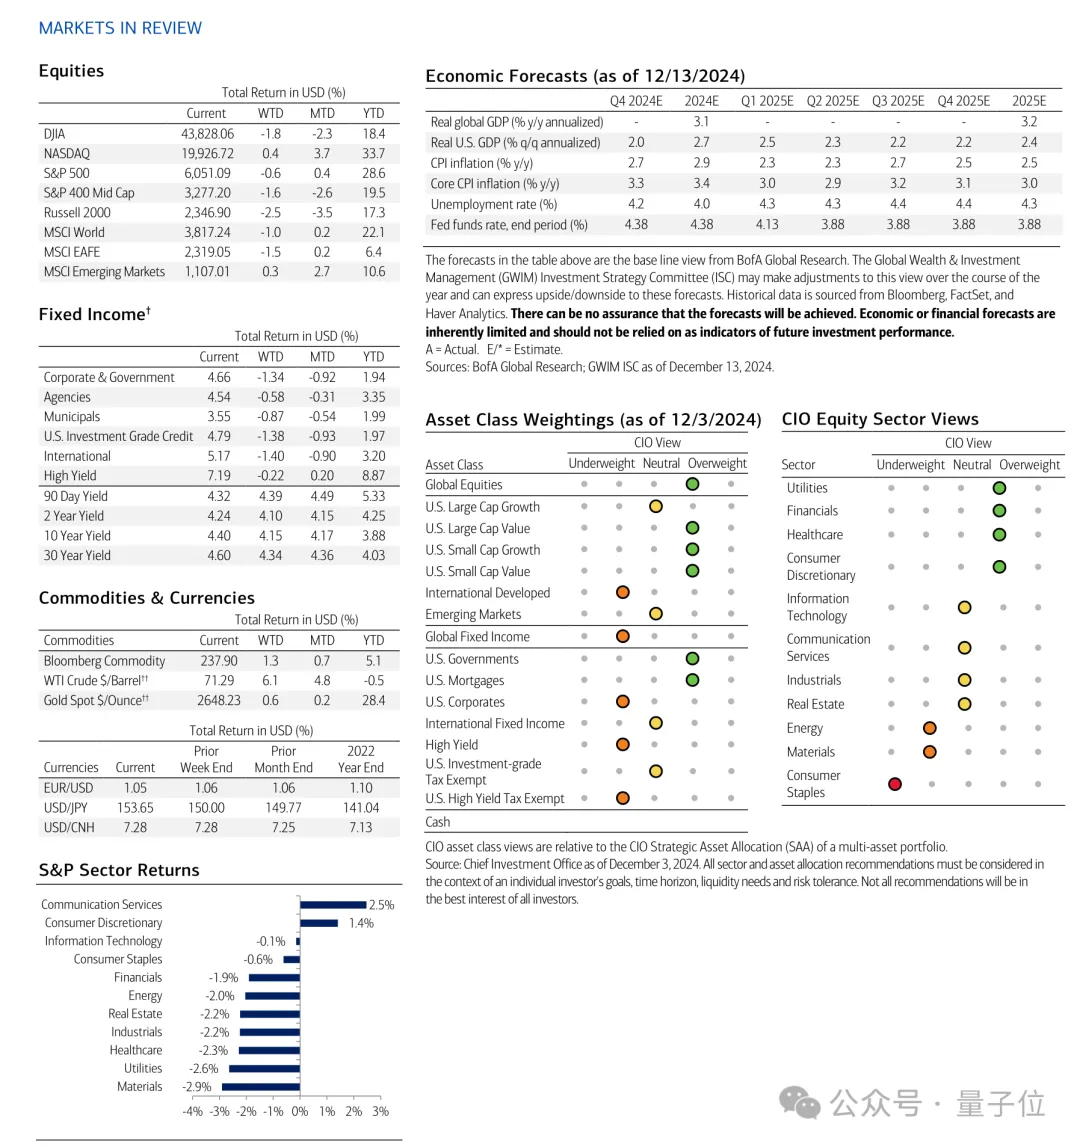
本案例研究將主要從美林證券(Merrill Lynch)于2024年12月16日發布的首席信息官資本市場展望中提取經濟預測。
我們將主要關注該文檔的第7頁,其中包含多個經濟變量,這些變量以表格、文本和圖像的混合形式組織。
FORECAST_FILE_PATH = "../data/input/forecast.pdf"首先,我們將使用MarkItDown從文檔中提取文本內容。
from markitdown import MarkItDown

md = MarkItDown()
result_md = md.convert(FORECAST_FILE_PATH).text_content
接下來,我們使用Docling進行同樣的操作。
from docling.document_converter import DocumentConverter

converter = DocumentConverter()
forecast_result_docling = converter.convert(source).document.export_to_markdown()
這兩個結果有多相似?
我們可以使用Levenshtein距離來衡量兩個結果之間的相似度。
還可以使用difflib包中的SequenceMatcher來計算一個簡單的分數,這是基于最長公共子序列中匹配數來衡量兩個字符串相似度的一個簡單度量。
import Levenshtein
def levenshtein_similarity(text1: str, text2: str) -> float:
    """
    Calculate normalized Levenshtein distance
    Returns value between 0 (completely different) and 1 (identical)
    """
    distance = Levenshtein.distance(text1, text2)
    max_len = max(len(text1), len(text2))
    return 1 - (distance / max_len)

from difflib import SequenceMatcher
def simple_similarity(text1: str, text2: str) -> float:
    """
    Calculate similarity ratio using SequenceMatcher
    Returns value between 0 (completely different) and 1 (identical)
    """
    return SequenceMatcher(None, text1, text2).ratio()
下面是Levenshtein和SequenceMatcher的具體分數:
levenshtein_similarity(forecast_result_md, forecast_result_docling)0.13985705461925346simple_similarity(forecast_result_md, forecast_result_docling)0.17779960707269155結果顯示,這兩個結果非常不同,Levenshtein和SequenceMatcher的相似度得分分別為約13.98%和17.77%。
Docling的結果是一份相當易讀的Markdown,展示了關鍵經濟變量及其預測。
相反,MarkItDown的結果有些雜亂,難以閱讀,但信息確實存在,只是沒有以結構化的格式呈現。
但是,這重要嗎?
先來看看Docling的結果:
display(Markdown(forecast_result_docling))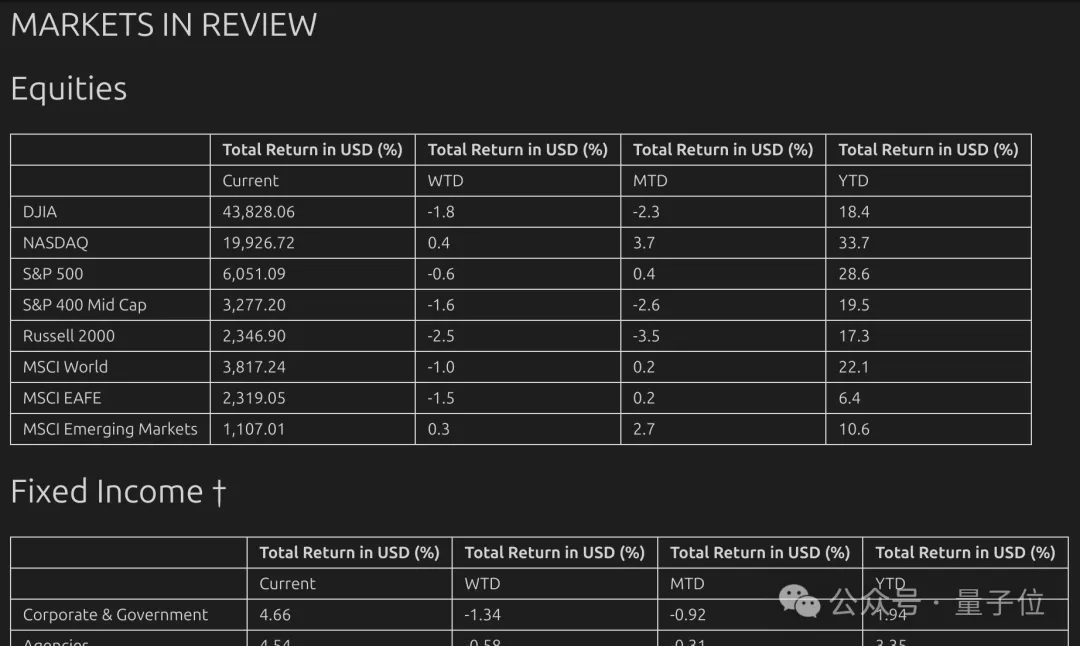
MarkItDown的結果:
from IPython.display import display, Markdown
display(Markdown(forecast_result_md[:500]))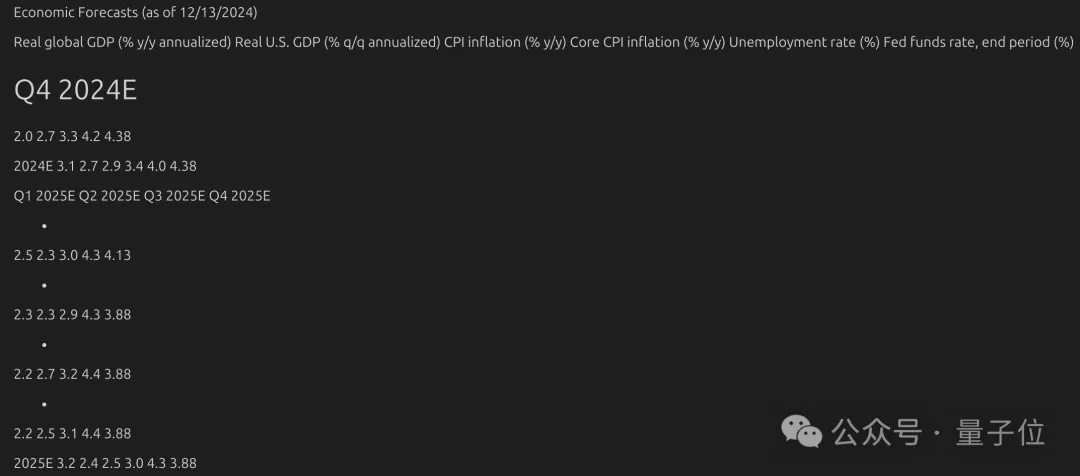
現在,讓我們看一下經濟預測的結果,主要關注提取CIO的2025E預測。

我們將定義一個Forecast pydantic模型來表示由financial_variable和financial_forecast組成的經濟預測。
定義另外一個EconForecast pydantic模型來表示我們想要從文檔中提取的經濟預測列表。
from pydantic import BaseModel
class Forecast(BaseModel):
    financial_variable: str
    financial_forecast: float
class EconForecast(BaseModel):
    forecasts: list[Forecast]
以下為提示模板,其中extract_prompt是用戶希望提取的數據, doc是待分析的輸入文檔。
BASE_PROMPT = f"""
    ROLE: You are an expert at structured data extraction.
    TASK: Extract the following data {extract_prompt} from input DOCUMENT
    FORMAT: The output should be a JSON object with 'financial_variable' as key and 'financial_forecast' as value.
    """
prompt = f"{BASE_PROMPT} \n\n DOCUMENT: {doc}"
我們編寫了一個簡單的函數,使用LLM模型(具有結構化輸出)從文檔中提取經濟預測
def extract_from_doc(extract_prompt: str,  doc: str, client) -> EconForecast:
    """
    Extract data of a financial document using an LLM model.

    Args:
        doc: The financial document text to analyze
        client: The LLM model to use for analysis
        extract_prompt: The prompt to use for extraction

    Returns:
        EconForecasts object containing sentiment analysis results
    """

    BASE_PROMPT = f"""
    ROLE: You are an expert at structured data extraction.
    TASK: Extract the following data {extract_prompt} from input DOCUMENT
    FORMAT: The output should be a JSON object with 'financial_variable' as key and 'financial_forecast' as value.
    """
    prompt = f"{BASE_PROMPT} \n\n DOCUMENT: {doc}"
    completion = client.beta.chat.completions.parse(
        model="gpt-4o-mini",
        messages=[
            {
                "role": "system",
                "content": prompt
            },
            {"role": "user", "content": doc}
        ],
        response_format=EconForecast
    )
    return completion.choices[0].message.parsed
from dotenv import load_dotenv
import os
# Load environment variables from .env file
load_dotenv(override=True)
from openai import OpenAI
client = OpenAI()然后,用戶調用extract_from_doc函數,簡單地定義“2025E 經濟預測”是他們想要從文檔中提取的數據。
我們執行提取兩次,一次使用MarkItDown,一次使用Docling。
extract_prompt = "Economic Forecasts for 2025E"
md_financials = extract_from_doc(extract_prompt, forecast_result_md, client)
docling_financials = extract_from_doc(extract_prompt, forecast_result_docling, client)
響應是一個包含Forecast對象列表的EconForecast對象,如pydantic模型中定義的那樣。
md_financialsEconForecast(forecasts=[Forecast(financial_variable='Real global GDP (% y/y annualized)', financial_forecast=3.2), Forecast(financial_variable='Real U.S. GDP (% q/q annualized)', financial_forecast=2.4), Forecast(financial_variable='CPI inflation (% y/y)', financial_forecast=2.5), Forecast(financial_variable='Core CPI inflation (% y/y)', financial_forecast=3.0), Forecast(financial_variable='Unemployment rate (%)', financial_forecast=4.3), Forecast(financial_variable='Fed funds rate, end period (%)', financial_forecast=3.88)])然后我們可以將響應轉換為pandas DataFrame格式,以便于比較。
df_md_forecasts = pd.DataFrame([(f.financial_variable, f.financial_forecast) for f in md_financials.forecasts],
                      columns=['Variable', 'Forecast'])
df_docling_forecasts = pd.DataFrame([(f.financial_variable, f.financial_forecast) for f in docling_financials.forecasts],
                      columns=['Variable', 'Forecast'])
df_md_forecasts
df_docling_forecasts
MarkItDown和Docling的結果完全相同,與文檔中的真實值準確匹配。
這表明,盡管從人類閱讀的角度來看,MarkItDown的輸出看起來不太易讀,但在此特定情況下,兩種方法都使LLM以相同的準確性成功提取經濟預測數據。
現在,讓我們關注資產類別權重。
我們將從文檔中提取資產類別權重,并比較MarkItDown和Docling的結果。
目前信息呈現的結構相當不同。CIO的觀點信息以“underweight”開始,經過“neutral”,達到“overweight”。
實際信息在圖表中以一些彩色點標出。讓我們看看我們是否可以從文檔中提取這些信息。

用戶只需定義以下數據以提取:“截至2024年12月3日的資產類別權重(-2至2的刻度)”。
這樣,我們預計“underweight”將映射為-2,“neutral”映射為0,“overweight”映射為2,之間還有一些數值。
extract_prompt = "Asset Class Weightings (as of 12/3/2024) in a scale from -2 to 2"
asset_class_docling = extract_from_doc(extract_prompt, forecast_result_docling, client)
asset_class_md = extract_from_doc(extract_prompt, forecast_result_md, client)
df_md = pd.DataFrame([(f.financial_variable, f.financial_forecast) for f in asset_class_md.forecasts],
columns=['Variable', 'Forecast'])
df_docling = pd.DataFrame([(f.financial_variable, f.financial_forecast) for f in asset_class_docling.forecasts],
columns=['Variable', 'Forecast'])現在我們構建一個DataFrame來比較MarkItDown和Docling的結果,并添加一個包含從文檔中手動提取的真實值的“true_value”列。
# Create DataFrame with specified columns
df_comparison = pd.DataFrame({
    'variable': df_docling['Variable'].iloc[:-1],
    'markitdown': df_md['Forecast'],
    'docling': df_docling['Forecast'].iloc[:-1],  # Drop last row
    'true_value': [1.0, 0.0, 1.0, 1.0, 1.0, -1.0, 0.0, -1.0, 1.0, 1.0, -1.0, 0.0, -1.0, 0.0, -1.0]
})


display(df_comparison)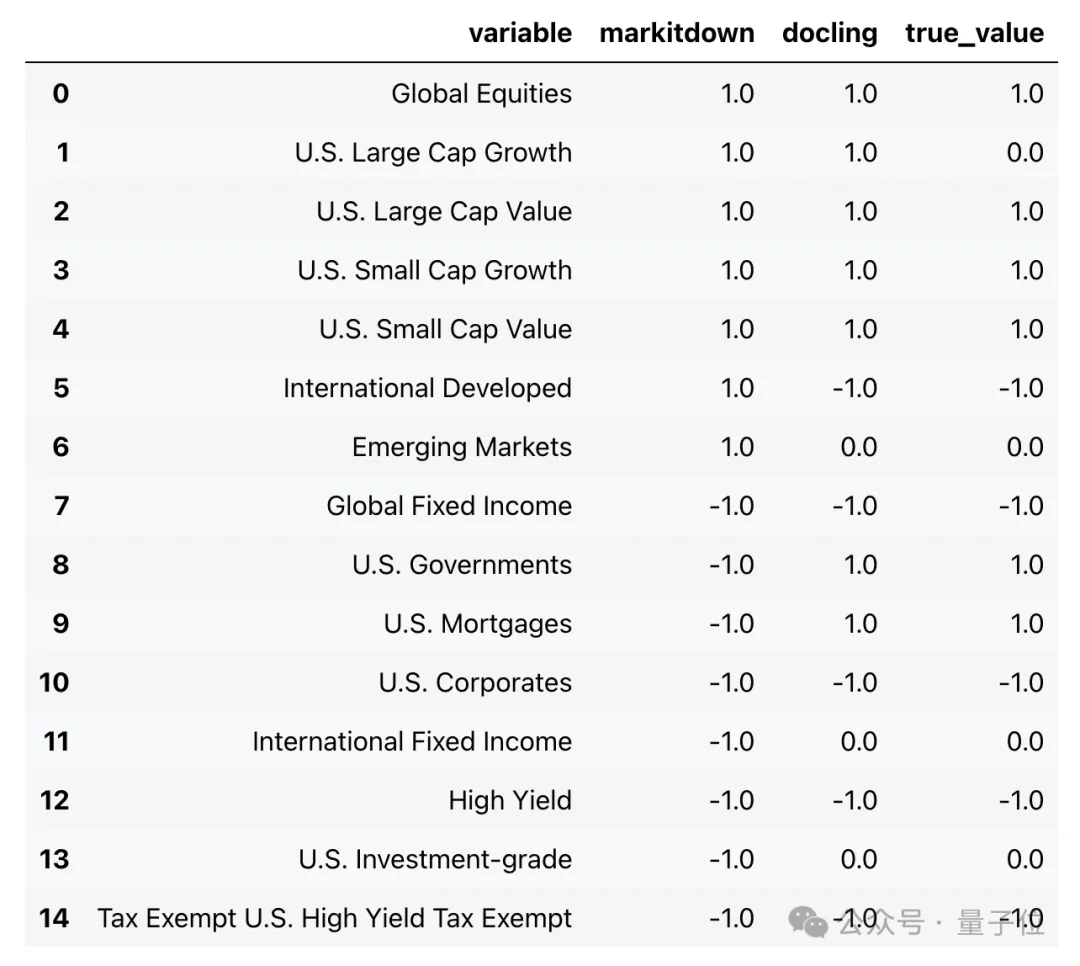
然后我們計算出Docling和MarkItDown的準確率:
# Calculate accuracy for markitdown and docling
markitdown_accuracy = (df_comparison['markitdown'] == df_comparison['true_value']).mean()
docling_accuracy = (df_comparison['docling'] == df_comparison['true_value']).mean()

print(f"Markitdown accuracy: {markitdown_accuracy:.2%}")
print(f"Docling accuracy: {docling_accuracy:.2%}")
Markitdown accuracy: 53.33%
Docling accuracy: 93.33%Docling的準確率達到了93.33%,僅缺失一個值。MarkItDown的準確率為53.33%,在細微的資產類別權重表現較差。
在這種情況下,LLM從Docling的結構化解析的輸出確實比從MarkItDown的無結構化輸出中提取了更精確的信息。
更穩健的分析將需要在大量樣本數據上運行多次數據提取以估計錯誤率。
如果我們想系統地從文檔中提取所有表格呢?
我們可以通過簡單地訪問DocumentConverter對象的tables屬性來使用 Docling 實現這一點。
import time
from pathlib import Path
import pandas as pd
from docling.document_converter import DocumentConverter
def convert_and_export_tables(file_path: Path) -> list[pd.DataFrame]:
"""
Convert document and export tables to DataFrames.
Args:
file_path: Path to input document
Returns:
List of pandas DataFrames containing the tables
"""
doc_converter = DocumentConverter()
start_time = time.time()
conv_res = doc_converter.convert(file_path)
tables = []
# Export tables
for table in conv_res.document.tables:
table_df: pd.DataFrame = table.export_to_dataframe()
tables.append(table_df)
end_time = time.time() - start_time
print(f"Document converted in {end_time:.2f} seconds.")
return tables# Convert and export tables
tables = convert_and_export_tables(Path(FORECAST_FILE_PATH))我們觀察到Docling從文檔中提取了7個表格。按照文檔中出現的順序,從上到下、從左到右導出表格。
len(tables)下面,我們可以看到成功提取的第一個表格是關于股票預測的,第二個是關于固定收益預測的,以及最后一個包含首席投資官股票行業觀點的表格。
display(tables[0])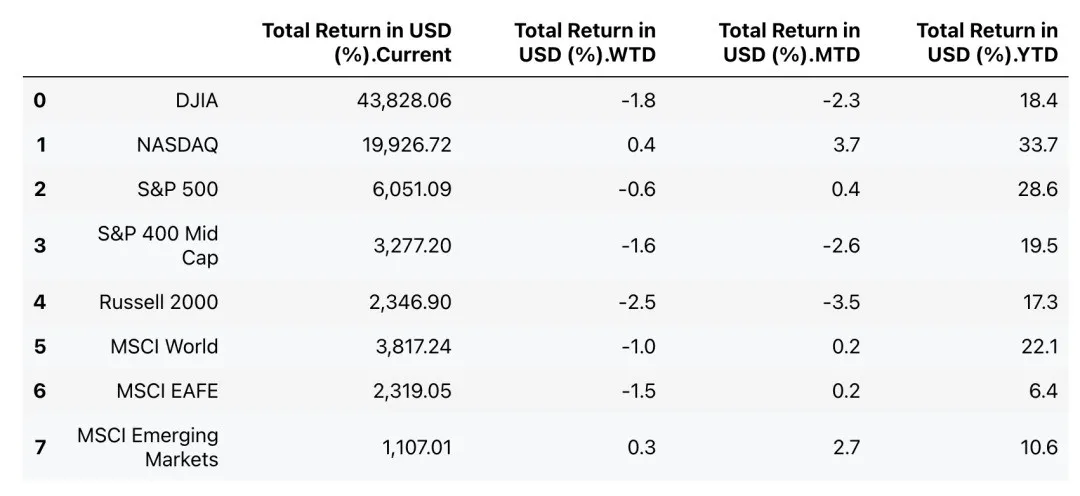
display(tables[1])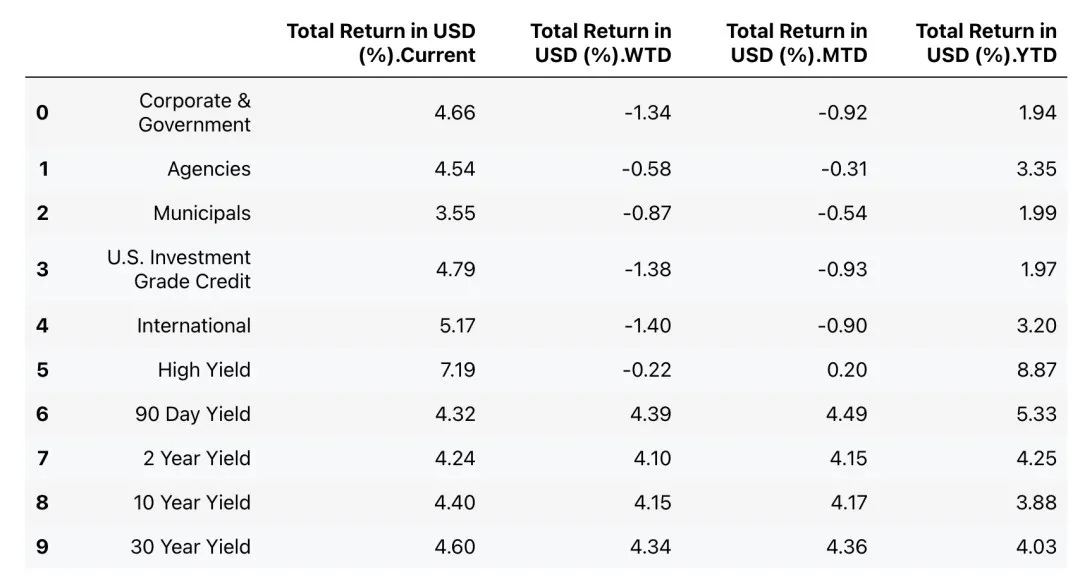
display(tables[6])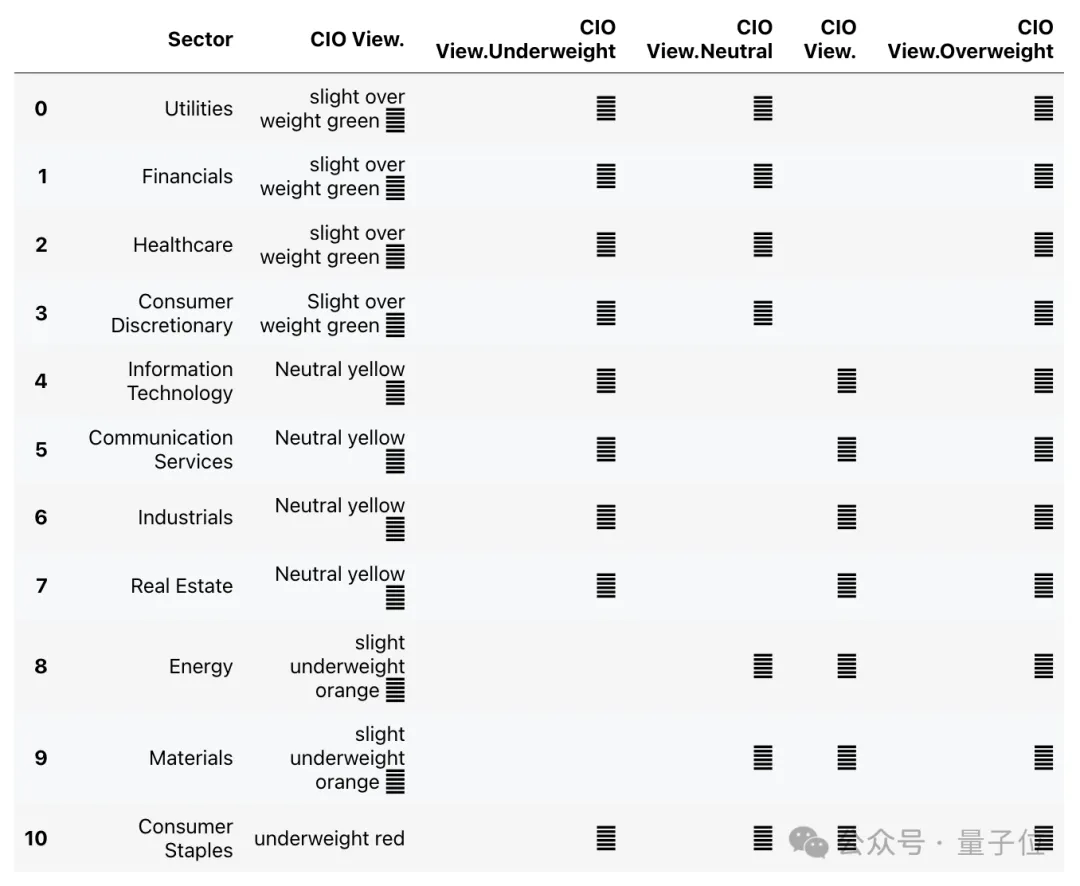
回到MarkItDown,它的一個重要特性是可以集成一個多模態LLM,從圖像中提取信息并進行分析與描述。
md_llm = MarkItDown(llm_client=client, llm_model="gpt-4o-mini")result = md_llm.convert("../data/input/forecast.png")以下是我們從輸入文檔的圖像中獲取的描述。
display(Markdown(result.text_content))
總體而言,該描述在某種程度上是準確的,但包含了一些不準確之處,包括:
- 關于板塊權重,描述中提到“在美國小盤成長股方面存在低配頭寸”,但從資產類別權重圖表來看,美國小盤成長股實際上顯示為超配頭寸(綠色圓圈)。
- 描述中提到“在公用事業和金融等某些板塊存在超配頭寸”,但從首席投資官股票板塊觀點來看,這兩個板塊都顯示為中立頭寸,而非超配頭寸。
- 對于固定收益,描述中提到“10年期(4.03%)”收益率,但圖片顯示的是30年期收益率為4.03%,而實際上10年期收益率為4.40%。
可以說,描述中的這些不準確之處可能是底層大型語言模型無法處理圖像的結果。需要進一步研究來確定是否確實如此。
更多好用的轉換庫
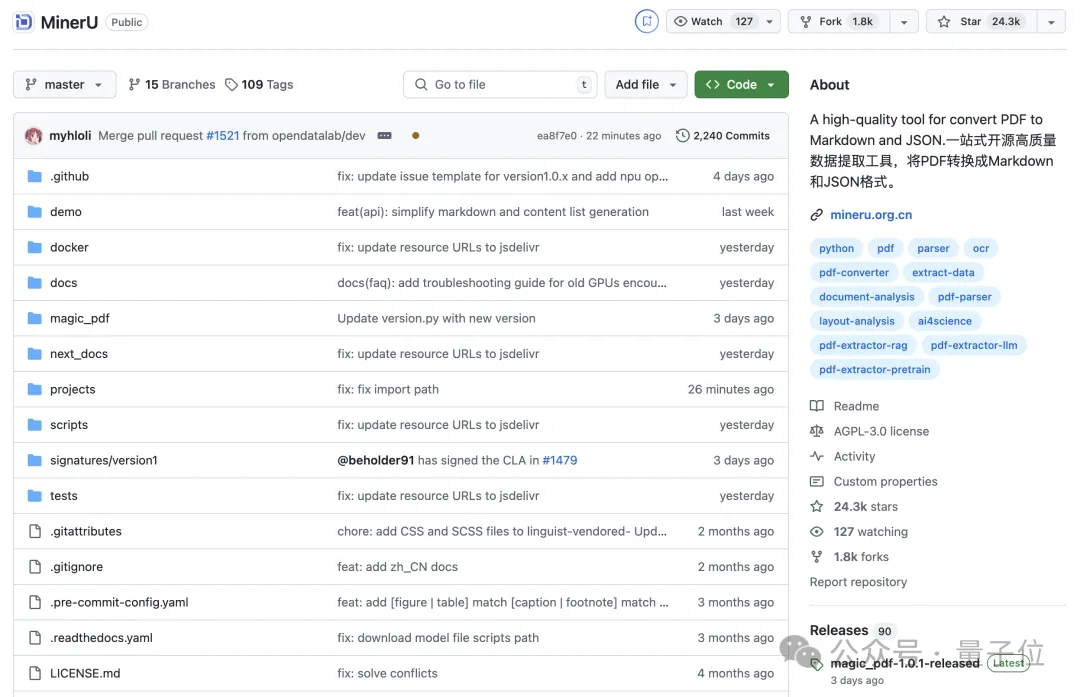
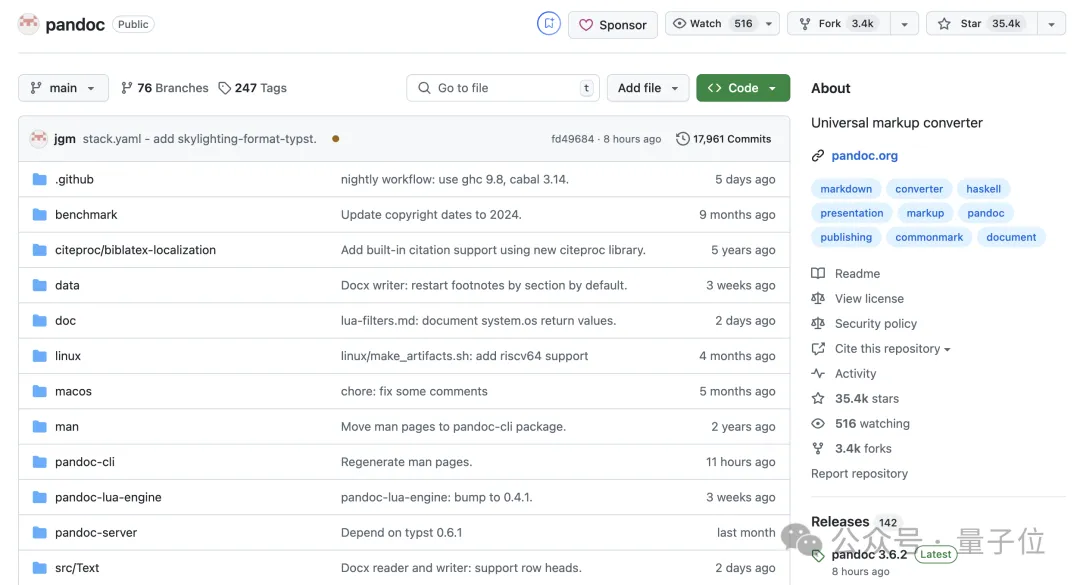
網友們還分享了其他好用的格式轉換庫,比如MinerU和Pandoc等。
MinerU收藏數超過2.4萬,還增加了對json格式的支持。
而Pandoc收藏數超過3.5萬,支持的文件類型更廣泛,甚至還包括輸出epub、ipynb等等。
下次需要將文件轉換成LLM容易處理的數據格式的時候,都可以試試哦!
在線版:https://www.getmarkdown.com/MarkltDown
庫地址:github.com/microsoft/markitdown


