可視化深度學習模型架構的六個常用的方法總結
可視化有助于解釋和理解深度學習模型的內部結構。 通過模型計算圖的可視化可以弄清楚神經網絡是如何計算的,對于模型的可視化主要包括以下幾個方面:
- 模型有多少層
- 每層的輸入和輸出形狀
- 不同的層是如何連接的?
- 每層使用的參數
- 使用了不同的激活函數
本文將使用 Keras 和 PyTorch 構建一個簡單的深度學習模型,然后使用不同的工具和技術可視化其架構。
使用Keras構建模型
import keras
# Train the model on Fashion MNIST dataset
(train_images, train_labels), _ = keras.datasets.fashion_mnist.load_data()
train_images = train_images / 255.0
# Define the model.
model = keras.models.Sequential([
keras.layers.Flatten(input_shape=(28, 28)),
keras.layers.Dense(32, activation='relu'),
keras.layers.Dropout(0.2),
keras.layers.Dense(10, activation='softmax')
])
#Compile the model
model.compile(
optimizer='adam',
loss='sparse_categorical_crossentropy',
metrics=['accuracy'])
Keras 內置可視化模型
在 Keras 中顯示模型架構的最簡單就是使用 summary()方法
model.summary()
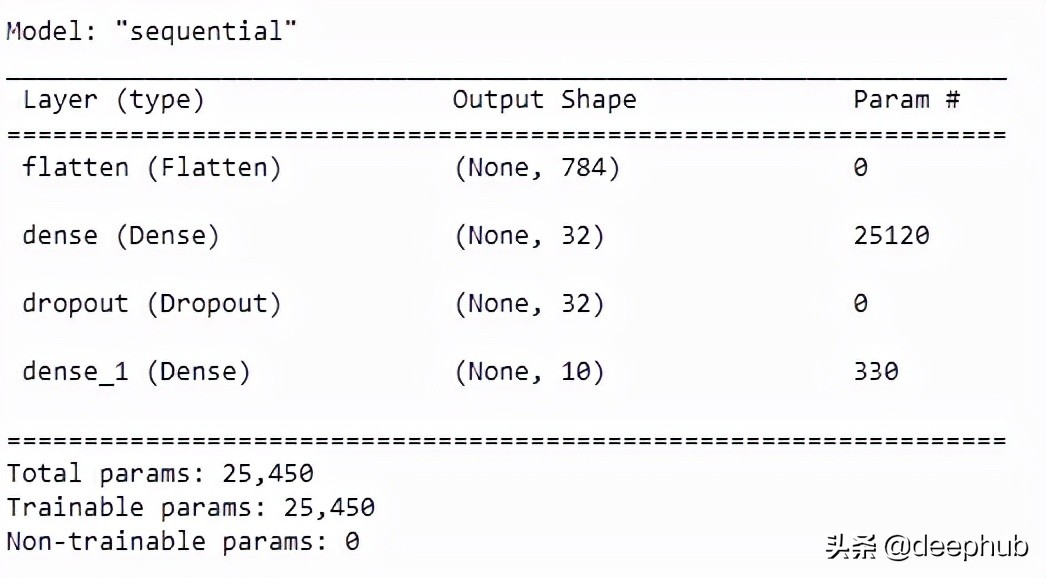
這個方法是keras內置的實現,他的原理很簡單。就是遍歷所有模型層并打印相關細節,如層的輸入維度和輸出維度、參數數量、激活類型等,我們也可以用for訓練遍歷實現,代碼如下:
for layer in model.layers:
print("Layer Name: " + layer.name)
print("Type of layer: " + layer.__class__.__name__)
print("Input dimesion: {}".format(layer.input_shape[1:]))
print("Output dimesion: {}".format(layer.output_shape[1:]))
print("Parameter Count: {}".format( layer.count_params()))
try:
print("Activation : " + layer.activation.__name__)
print(" ")
except:
print(" ")
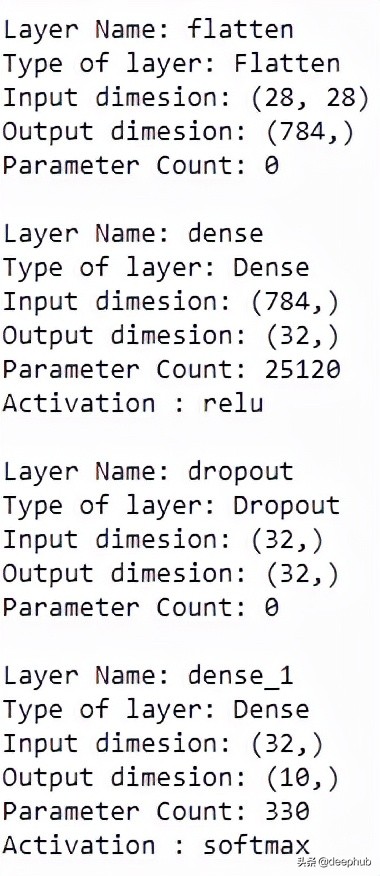
這種方法只能提供一些簡單的信息,下面我們介紹一些更好用的方法
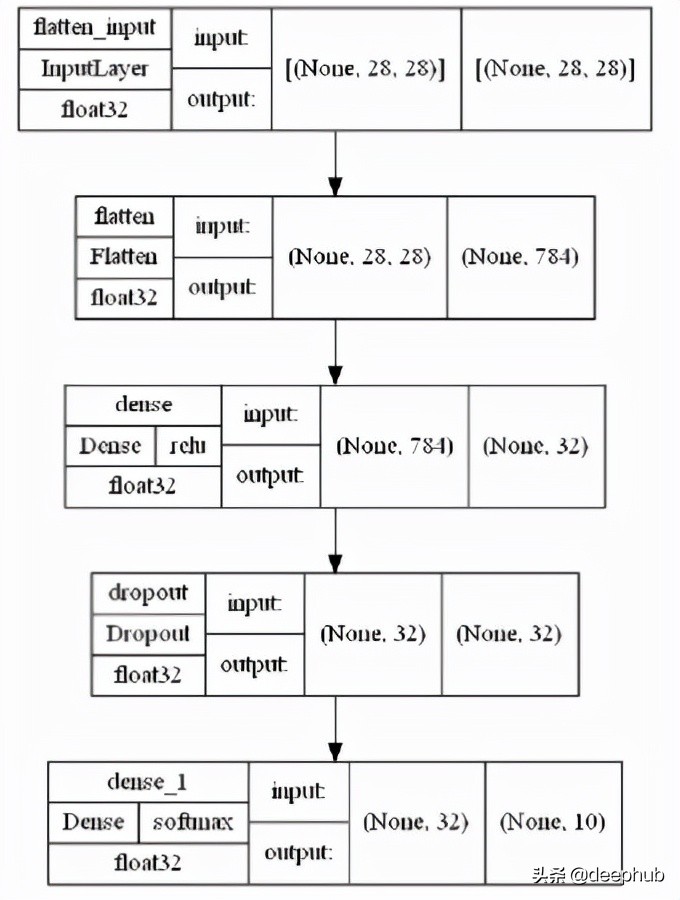
Keras vis_utils
keras.utils.vis_utils 提供了使用 Graphviz 繪制 Keras 模型的實用函數。但是在使用之前需要安裝一些其他的依賴:
pip install pydot
pip install pydotplus
pip install graphviz
使用Graphviz,還需要在系統 PATH 中添加 Graphviz bin 文件夾的路徑,設置完成后就可以使用了
model_img_file = 'model.png'
tf.keras.utils.plot_model(model, to_file=model_img_file,
show_shapes=True,
show_layer_activations=True,
show_dtype=True,
show_layer_names=True )
Visualkears
Visualkears 庫只支持 CNN(卷積神經網絡)的分層樣式架構生成和大多數模型的圖形樣式架構,包括普通的前饋網絡。
pip install visualkeras
layered view() 用于查看 CNN 模型架構
visualkeras.layered_view(model,legend=True, draw_volume=True)
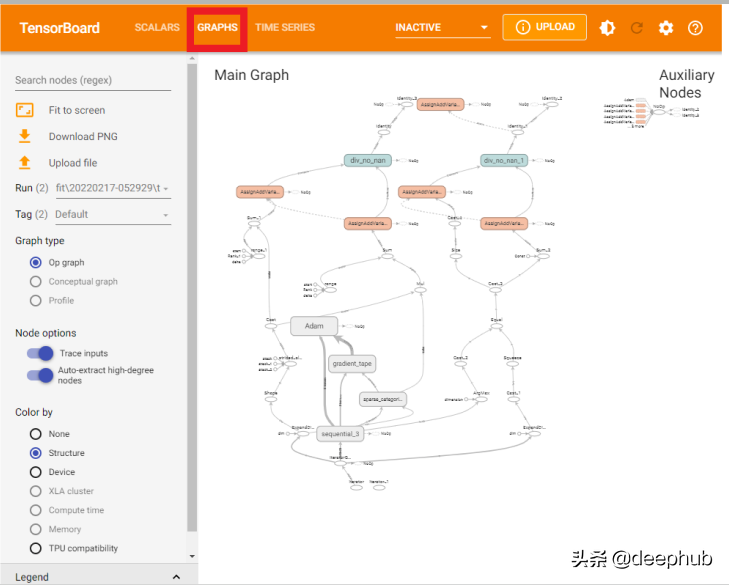
TensorBoard
TensorBoard 的 Graphs 可查看模型結構圖。對于 Tensorboard,使用如下的方法。
import tensorflow as tf
from datetime import datetime
import tensorboard
如果需要在notebook中使用,可以用下面的語句加載 Tensorboard 擴展
%load_ext tensorboard
在 fit() 中使用的 Keras Tensorboard Callback
# Define the Keras TensorBoard callback.
logdir="logs/fit/" + datetime.now().strftime("%Y%m%d-%H%M%S")
tensorboard_callback = keras.callbacks.TensorBoard(log_dir=logdir)
# Train the model.
model.fit(
train_images,
train_labels,
batch_size=64,
epochs=5,
callbacks=[tensorboard_callback])

model.save("model.h5")
模型訓練完成后,啟動 TensorBoard 并等待 UI 加載。
%tensorboard --logdir logs
通過單擊的“Graphs”就可以看到模型的可視化結果了。
注:在Pytorch 1.8以后中提供了from torch.utils.tensorboard import SummaryWriter也可以生成tensorboard的數據,與tensorboard 對接。
Netron
Netron 是專門為神經網絡、深度學習和機器學習模型設計的查看器。 它支持 Keras、TensorFlow lite、ONNX、Caffe,并對 PyTorch、TensorFlow 有實驗性支持。
pip install netron
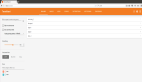
瀏覽器并輸入netron.app ,請單擊“打開模型”并選擇 h5 文件的路徑上傳。
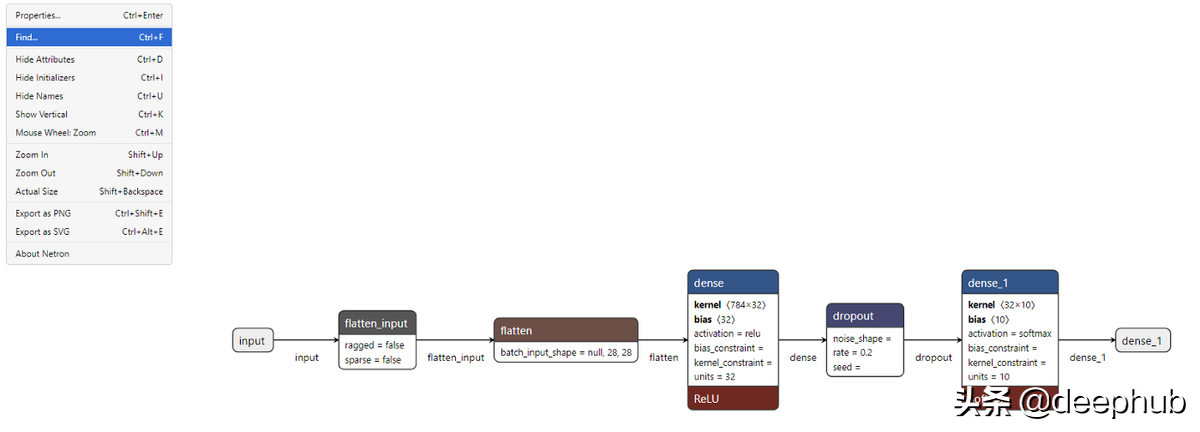
就可以看到每一層的可視化結果了。
在 PyTorch 中構建一個簡單的深度學習模型
import torch
from torch import nn
# Get cpu or gpu device for training.
device = "cuda" if torch.cuda.is_available() else "cpu"
print(f"Using {device} device")
class NeuralNetwork(nn.Module):
def __init__(self):
super(NeuralNetwork, self).__init__()
self.flatten = nn.Flatten()
self.linear_relu_stack = nn.Sequential(
nn.Linear(28*28, 512),
nn.ReLU(),
nn.Linear(512, 512),
nn.ReLU(),
nn.Linear(512, 10),
)def forward(self, x):
x = self.flatten(x)
logits = self.linear_relu_stack(x)
return logits
pytorch_model = NeuralNetwork().to(device)
x = torch.randn( 512, 28,28,1).requires_grad_(True)
y = pytorch_model(x)
查看模型架構最直接的方法是打印它。
print(pytorch_model)
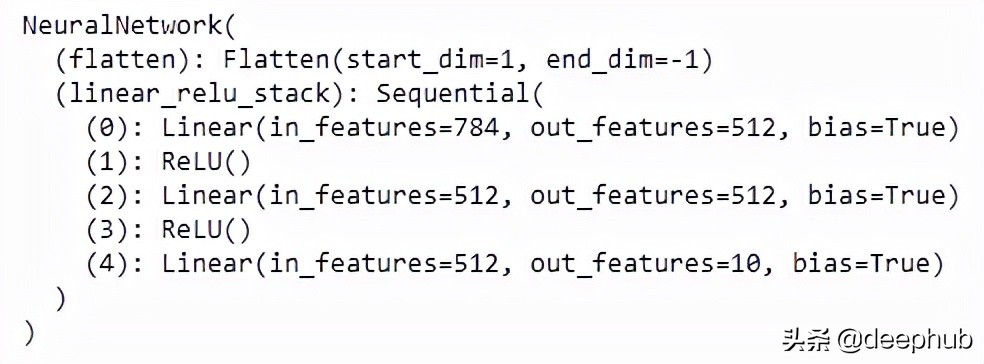
雖然可以看到完整的模型架構,但是效果還沒有Keras的內置函數效果好,下面介紹一個很好用的庫解決這個問題。
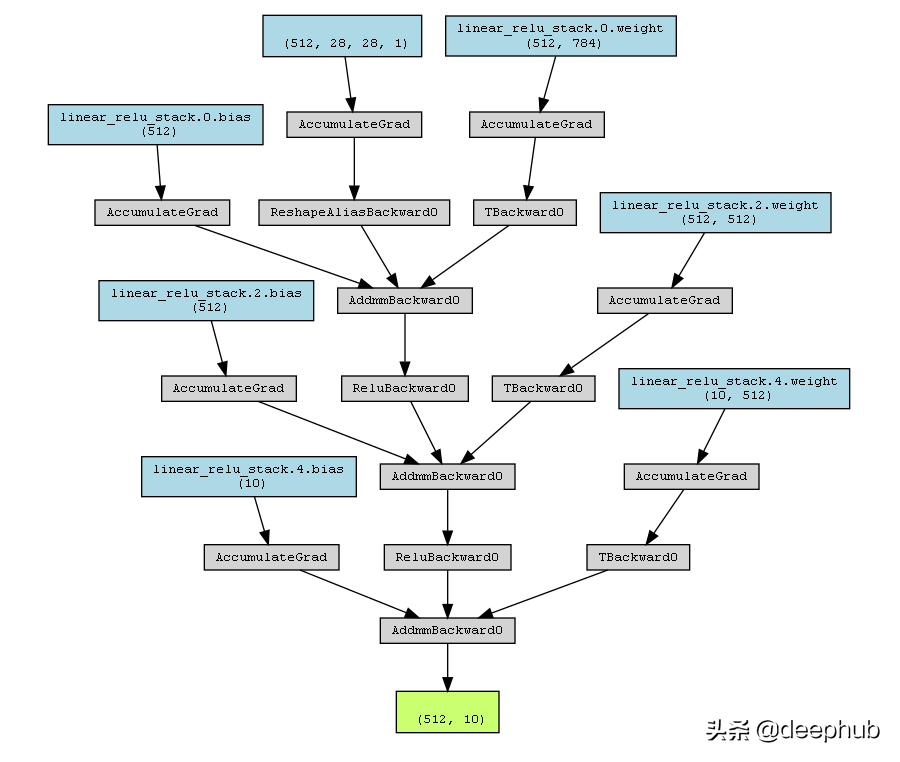
PyTorchViz
PyTorchViz 依賴于graphviz,所以也需要安裝:
pip install graphviz
pip install torchviz
使用PyTorchViz 可視化模型非常簡單,只需要一個方法即可:
from torchviz import make_dot
make_dot(y, params=dict(list(pytorch_model.named_parameters()))).render("torchviz", format="png")
上面的代碼生成了一個torchviz.png文件,如下圖。
總結
可視化模型架構可以更好的解釋深度學習模型。 模型結構可視化顯示層數、每層數據的輸入和輸出形狀、使用的激活函數以及每層中的參數數量,為優化模型提供更好的理解。